

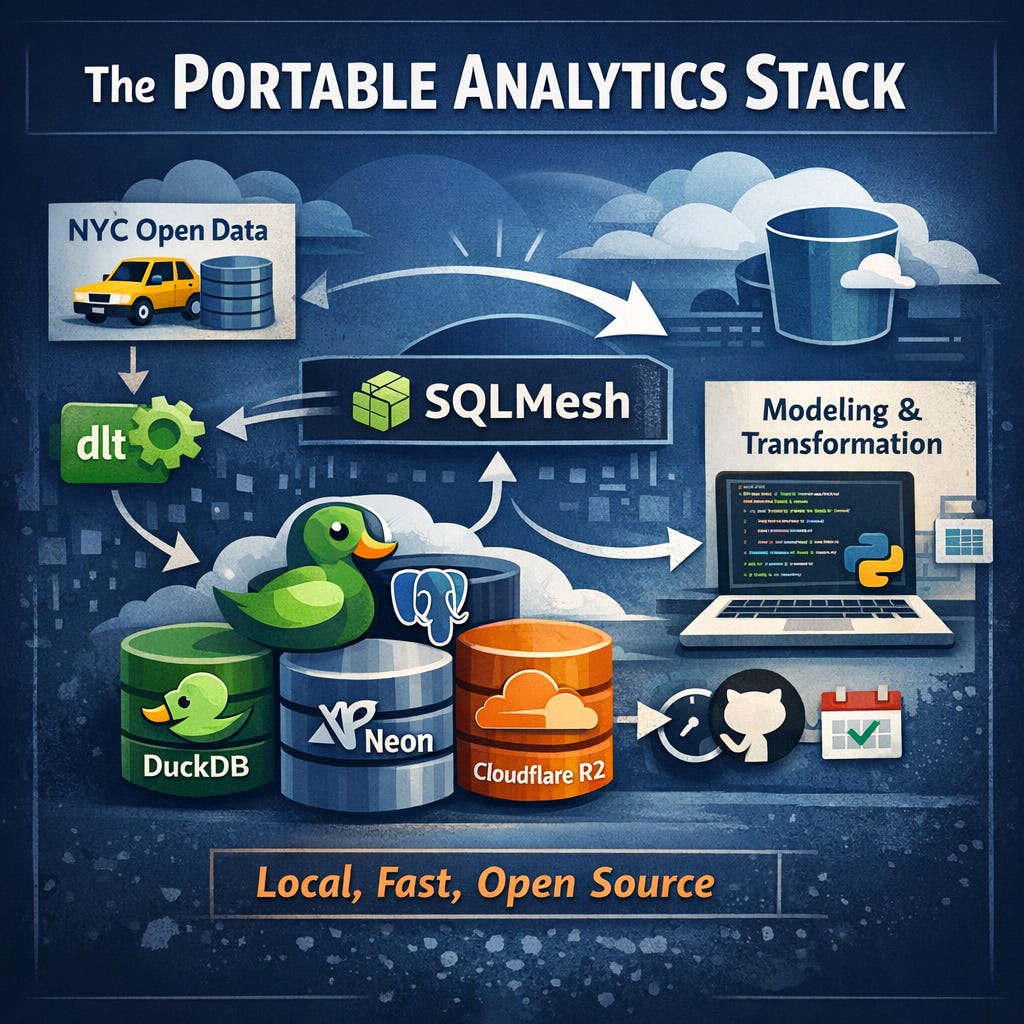
A Portable Analytics Stack
Ephemeral compute, shared state, and object storage—no warehouse required.

Today, we have a guest post from Yuki, who writes on a few Substacks, The Data Toolbox, and Struggling Data. You can also follow him on LinkedIn.

Modern data stacks are often described as composable, but even when tools come from different vendors, their defaults often assume centralized infrastructure and managed runtimes. For some teams and practitioners, this introduces unnecessary friction:
Vendor and platform coupling
Slow iteration cycles
Unpredictable costs
Operationally complex infrastructure
A portable analytics stack flips that model. Instead of anchoring analytics to a single warehouse or execution environment, it focuses on tools that can run anywhere, locally on your machine or on a scheduled runner. The result is a stack that’s fast, lightweight, open source, and easy to version-control. And it’s still integrating cleanly with cloud object storage and shared state for durability and collaboration. You get the utility of local development with the reliability and deployment patterns of modern data engineering.
In this article, we’ll walk through a practical portable stack combining several tools—dlt, SQLMesh, DuckDB, and DuckLake on Cloudflare R2. The goal isn’t to build a toy demo or to give you a half broken implementation. It’s to give you an example of something that works, that you can use as a starting point for your real workloads.
Implementation Design
This is what the implementation of this project looks like:
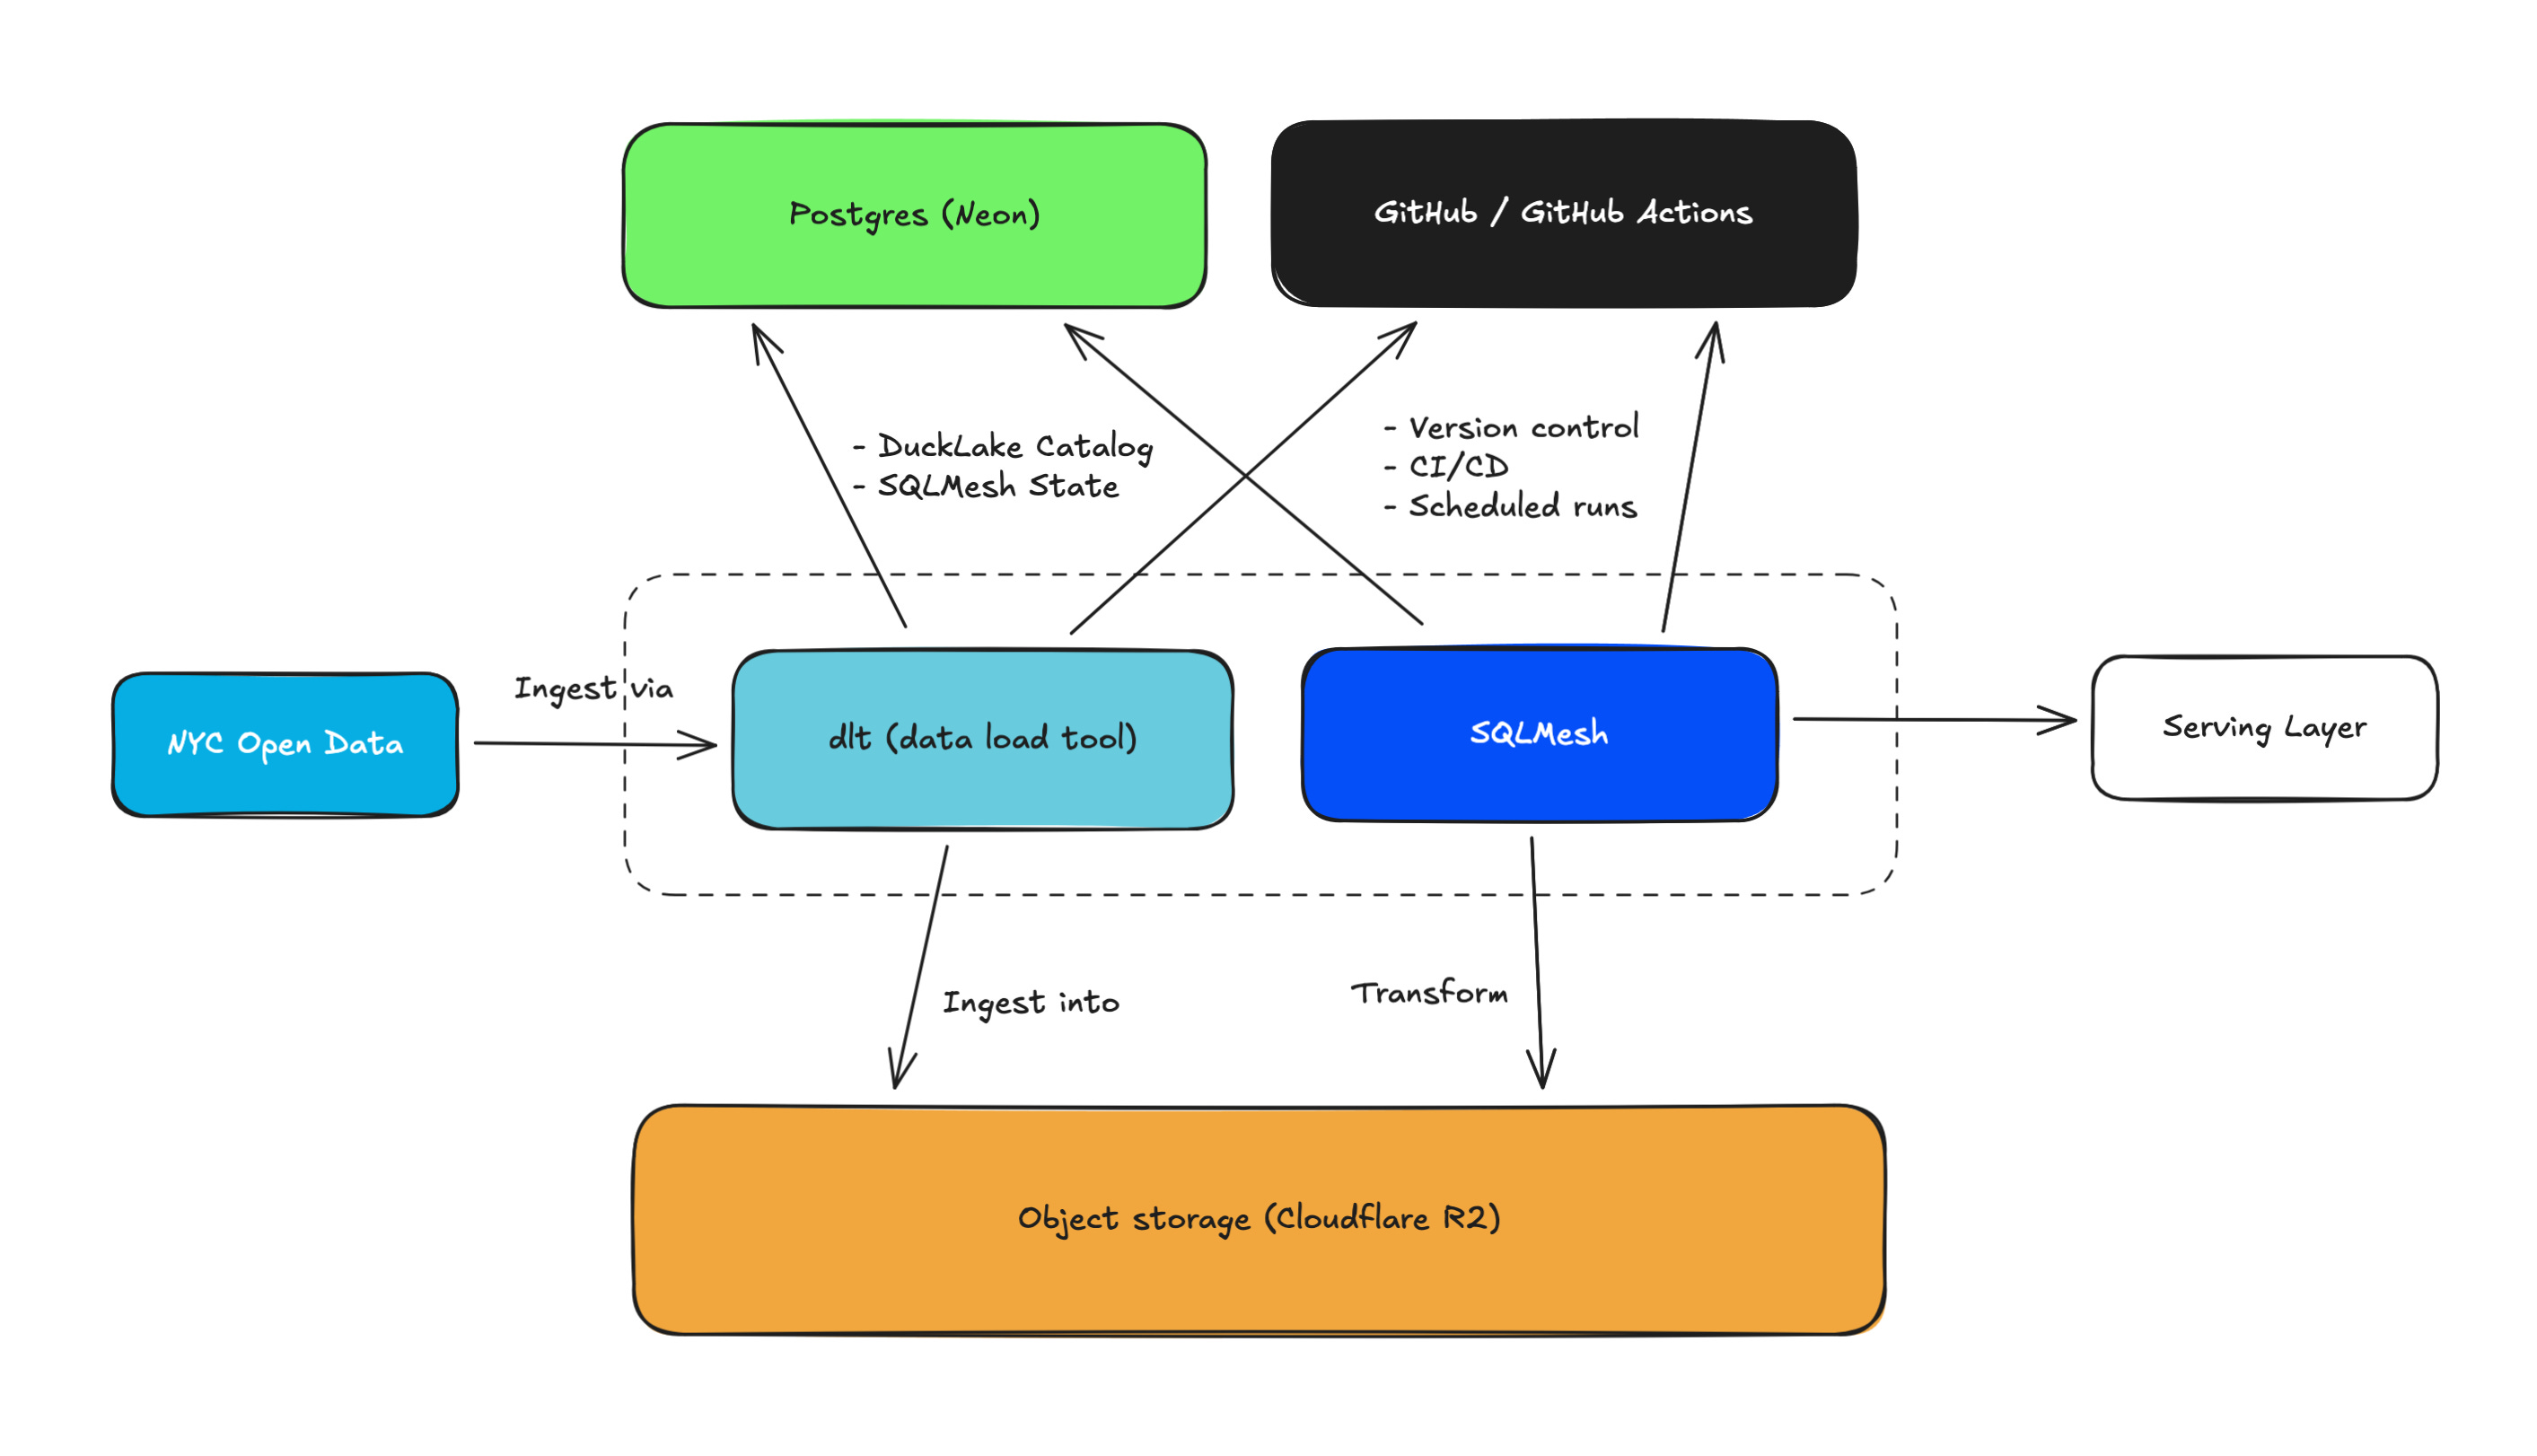
Let’s go over each component:
NYC Open Data: The Motor Vehicle Collisions dataset is used in this project
dlt (data load tool): An open-source Python library for data ingestion. dlthub is the company that started it and is still contributing a lot to its development.
SQLMesh: A data transformation framework, aka, the best alternative to dbt. Tobiko Data is the company behind the development of SQLMesh.
Cloudflare R2: A cost-friendly object storage.
Postgresql (on Neon): A serverless postgres with a generous free tier. This postgres instance manages DuckLake catalog/metadata and SQLMesh model states.
GitHub / GitHub Actions: For version control, CI/CD, and scheduled runs.
Technically, you can have pretty much everything run locally, including Postgres and object storage. So, if you would rather not use anything in the cloud, then you can absolutely do that.
Also, as you can see, the serving layer is out of scope in this project. I discuss a few BI and analytics options at the end of this article, but I focus primarily on data ingestion and modeling.
Initial Setup
Before we get started, we need to set up a few things.
Configure a R2 bucket (or it could be a S3 bucket).
Set up a Postgres instance (I’m using Neon).
Clone the GitHub repo (you need to fork it if you want to test the CI/CD jobs).
In the
portable-analytics-stackdirectory, copy.env.exampleand create.env. Make sure to add your env variables.Install uv if you haven’t. You can install it either via pip or brew if you’re on Mac. If you’re running this project in a dev container then you won’t need to explicitly install uv.
Once that’s done, run this command and you’re all set:
make syncI set up a Makefile to make it easier to manage a series of cli commands for the project.
Data Ingestion
dlt is good at templating your Python scripts for data ingestion. It gives you a structure to start with, which helps you develop custom ingestion scripts a lot faster and in a more reliable way than you coding all the way through on your own. And better yet, dlt has its DuckLake integration. It’s perfect for this project.
I’ll be using the exact same data source I used in this other article.
Code
Let’s take a look at the ingestion script:
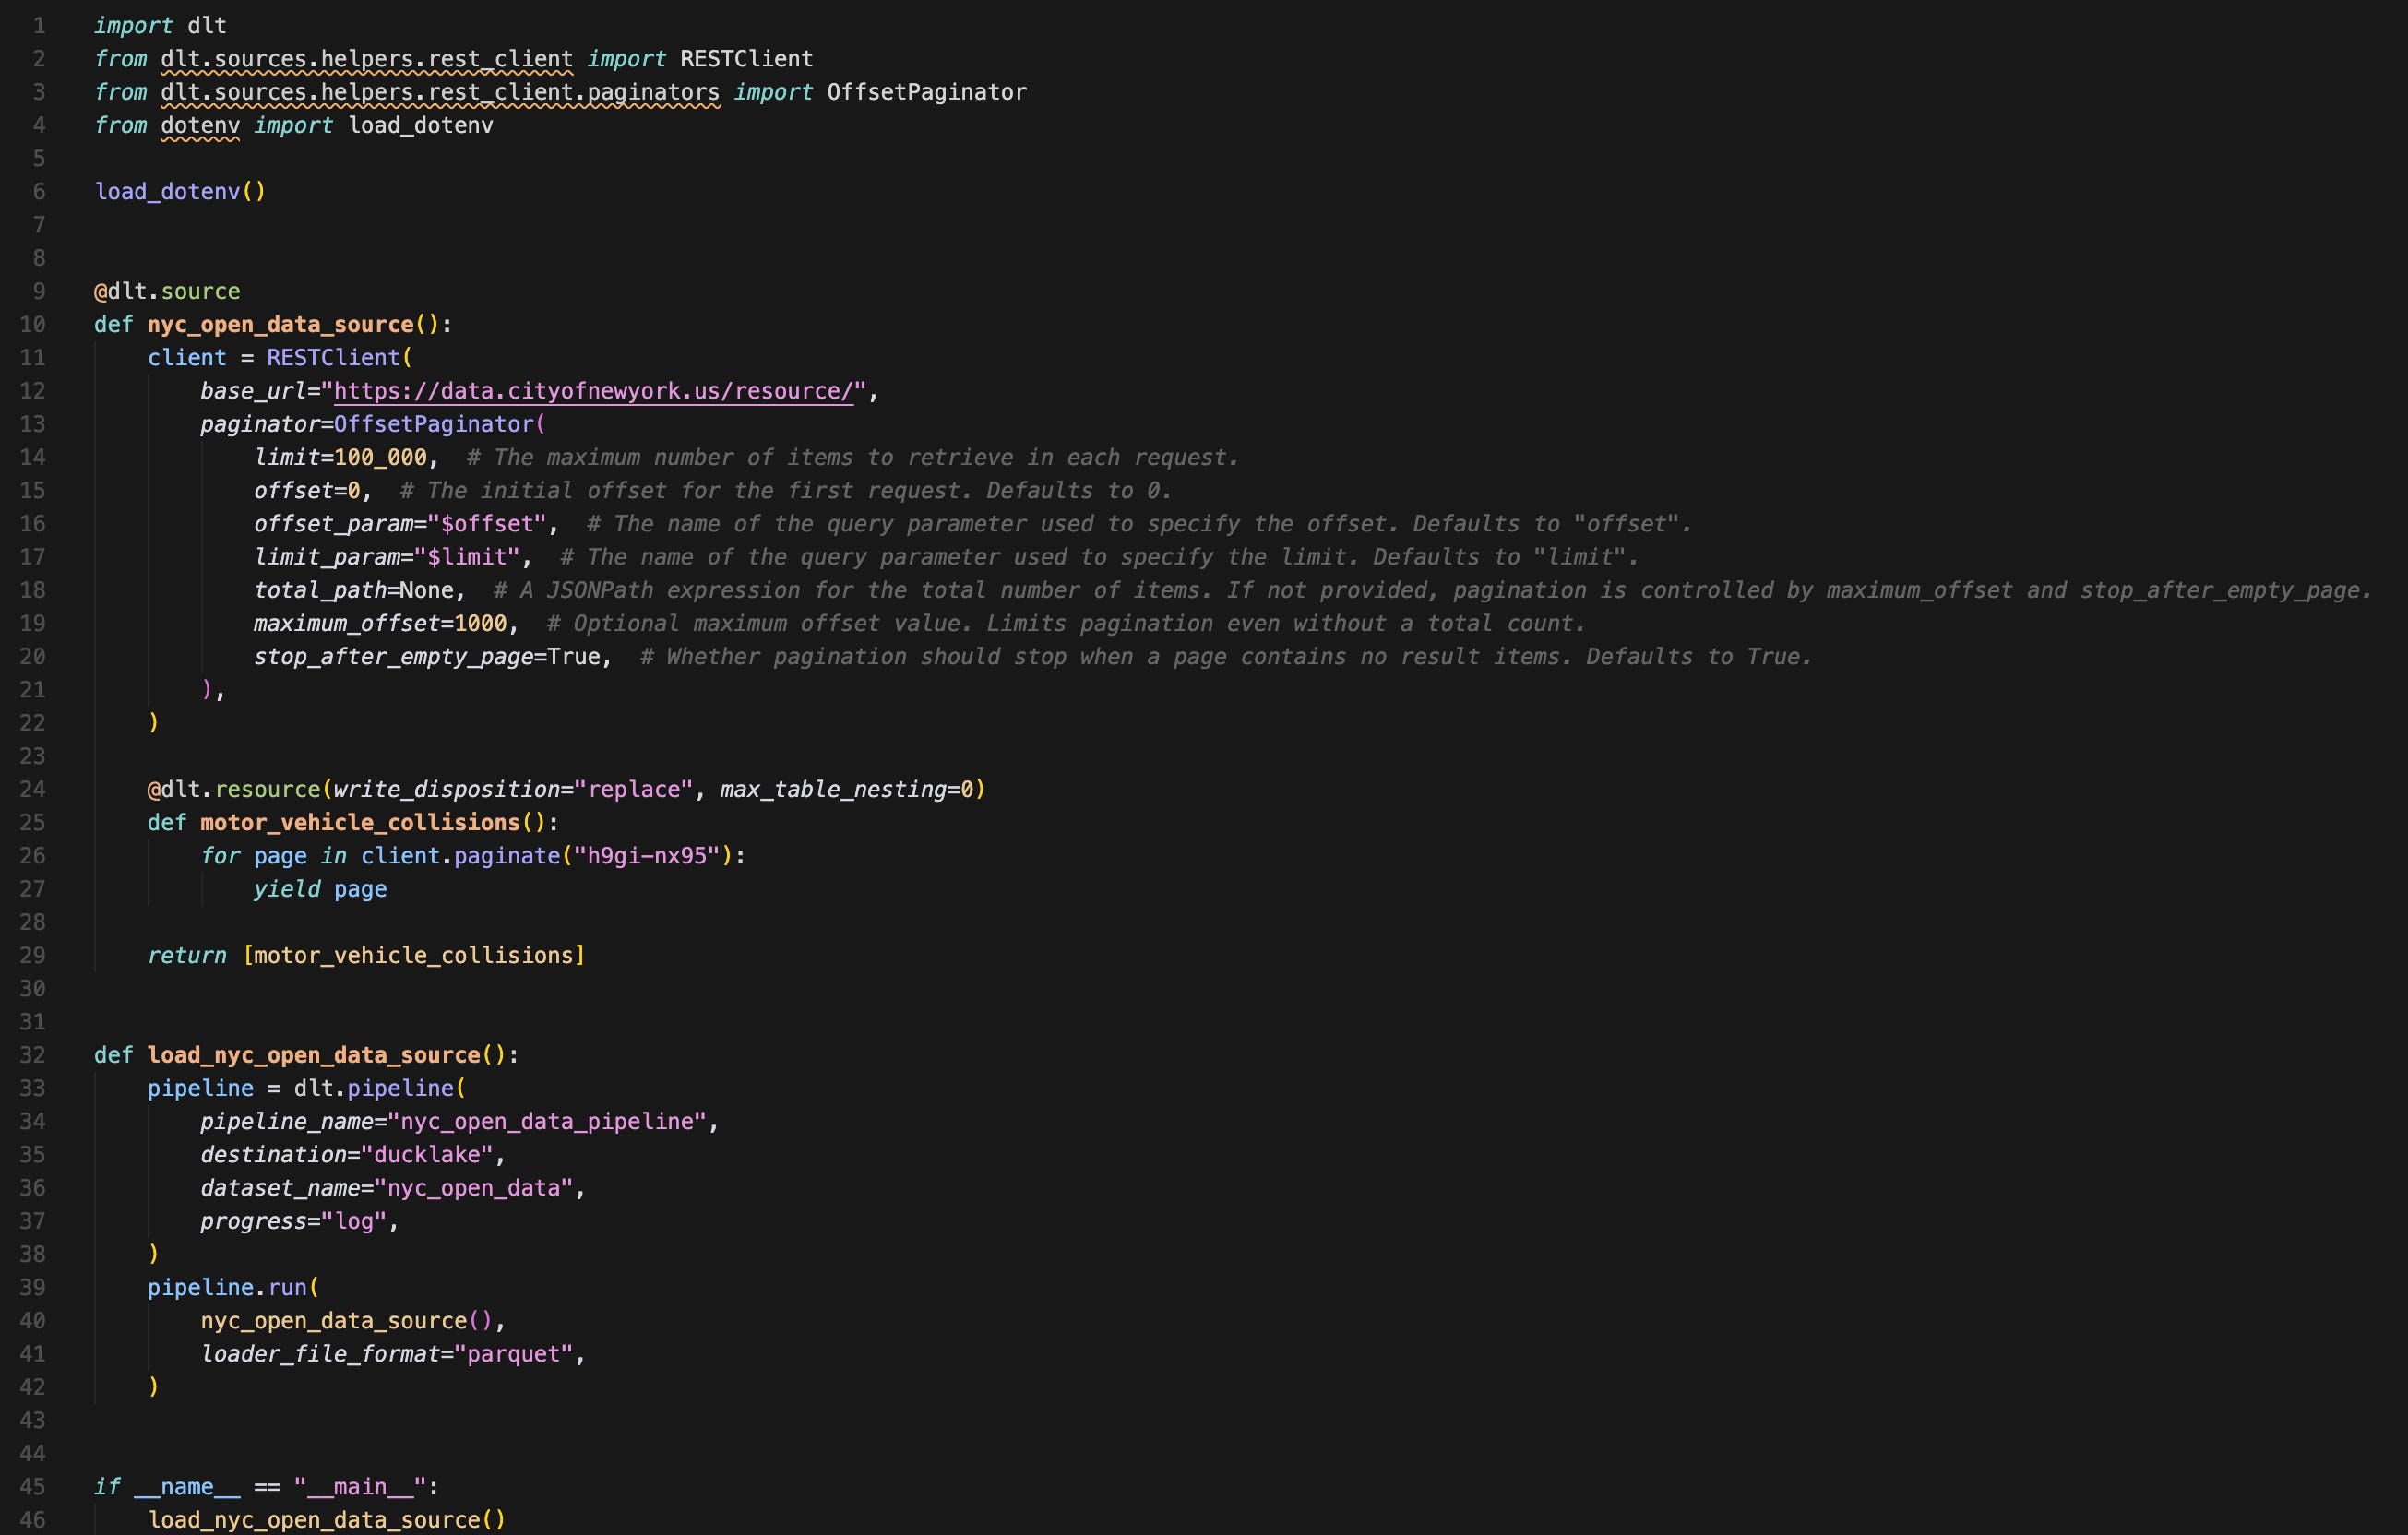
A few things to note:
The script is less than 50 lines of code.
2 functions:
One function defines how you ingest—specifying pagination, write disposition, and what endpoints you’re hitting.
Another one defining the pipeline details—pipeline name, destination, file format, etc.
There are no secrets or configurations from env variables imported in the ingestion script itself. That’s because dlt can reference env variables as long as their names are set up properly. You can also set up a script to pull secrets from your secret manager in your cloud at run time.
Executing the Ingestion Job
To run the ingestion script, run the following from the root directory of the project (portable-analytics-stack directory):
make dlt-ingest
# cd dlt && uv run python rest_api_pipeline.py under the hood
And once the script finishes running, you can check the job details:
make dlt-pipeline-info
# cd dlt && uv run dlt pipeline nyc_open_data_pipeline info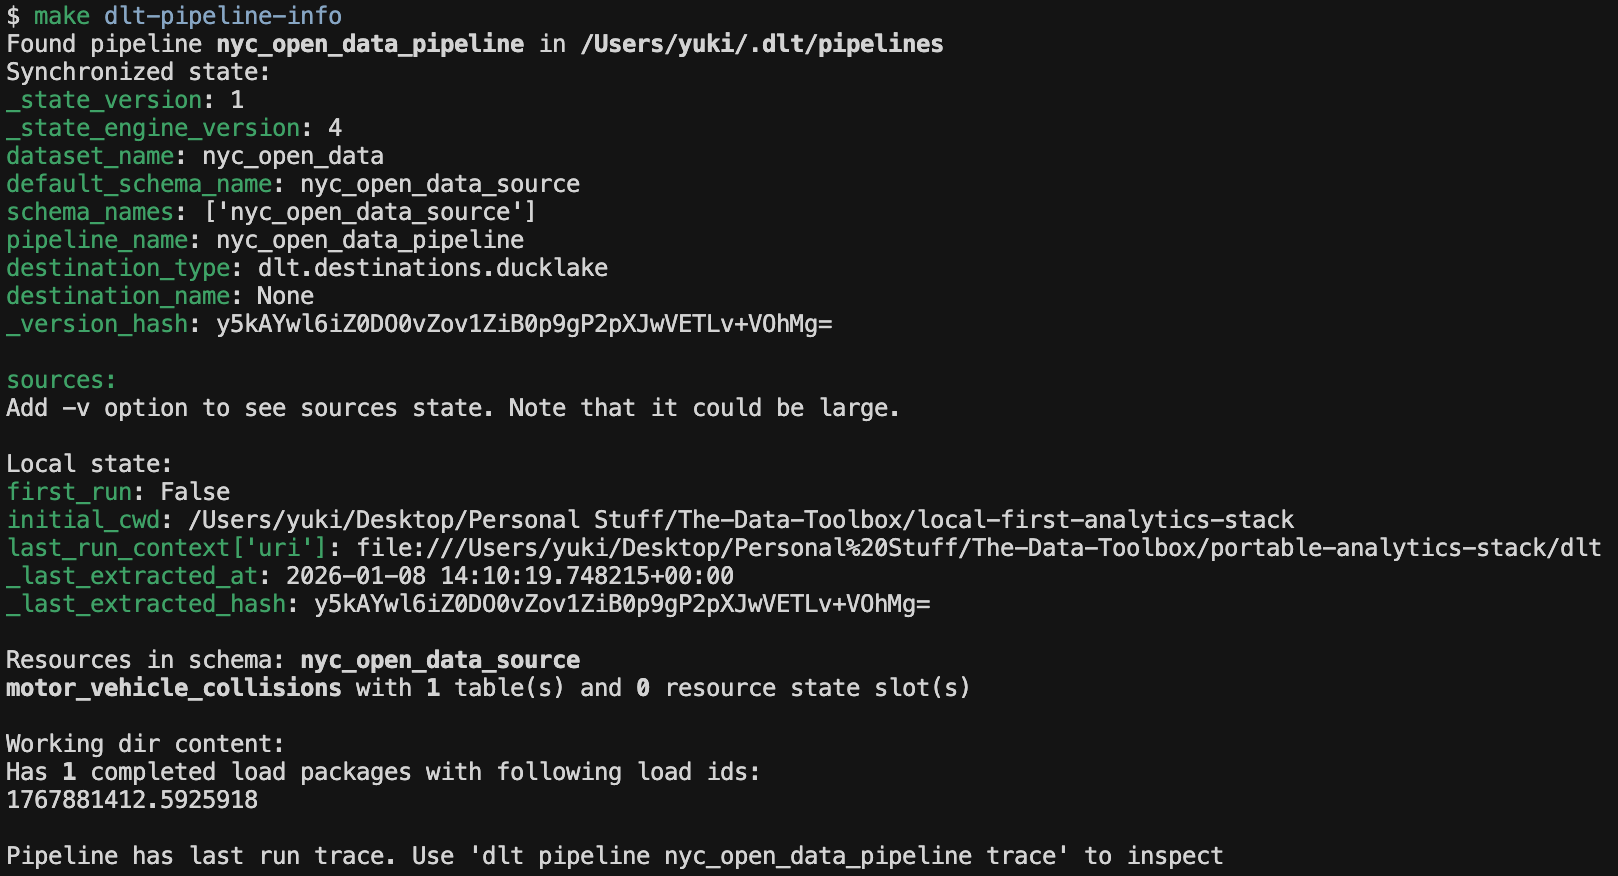
Check the Data in R2
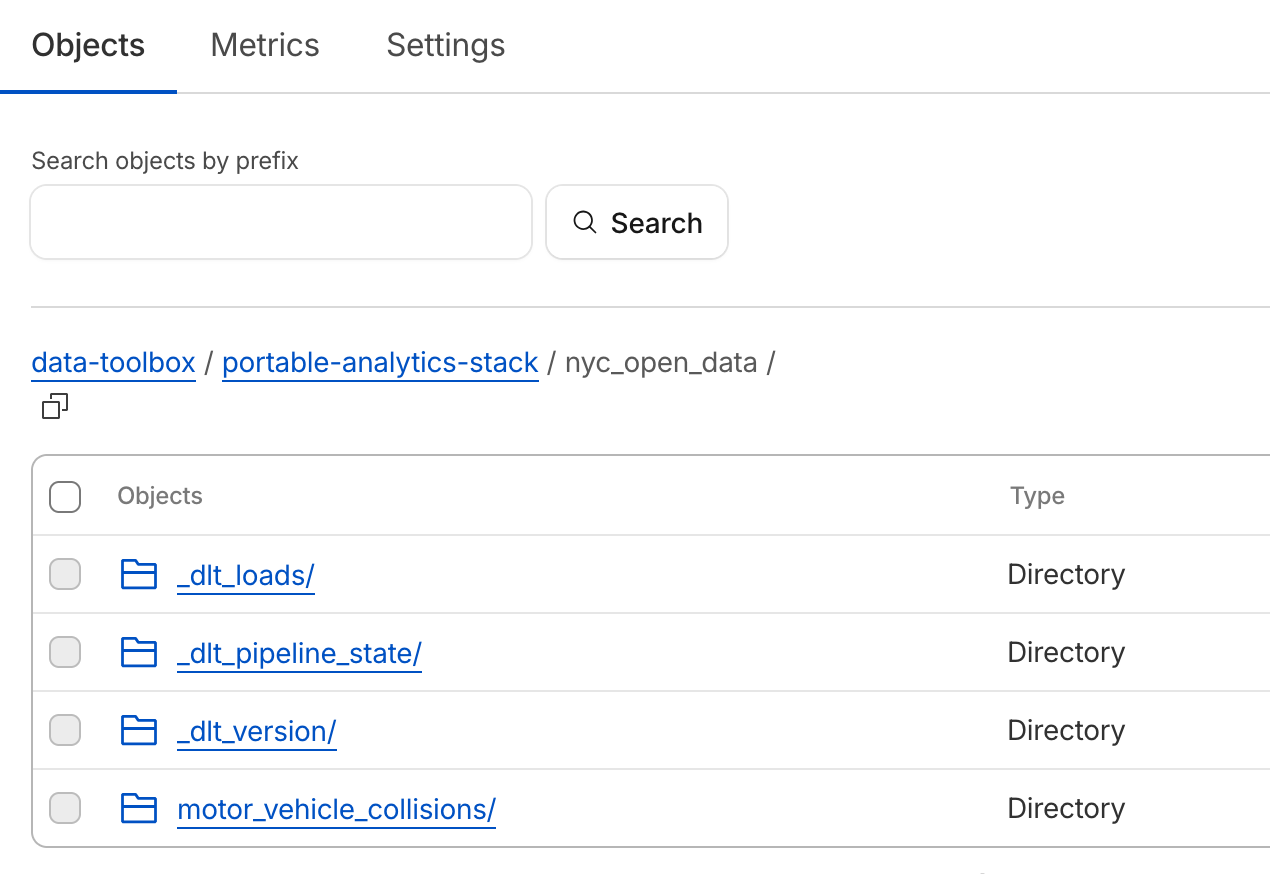
Let’s see the data we ingested in an R2 bucket. Under my original bucket data-toolbox, Now you see new directories and files, for both dlt job’s details, like states and versions, as well as actual data in a directory called motor_vehicle_collisions:
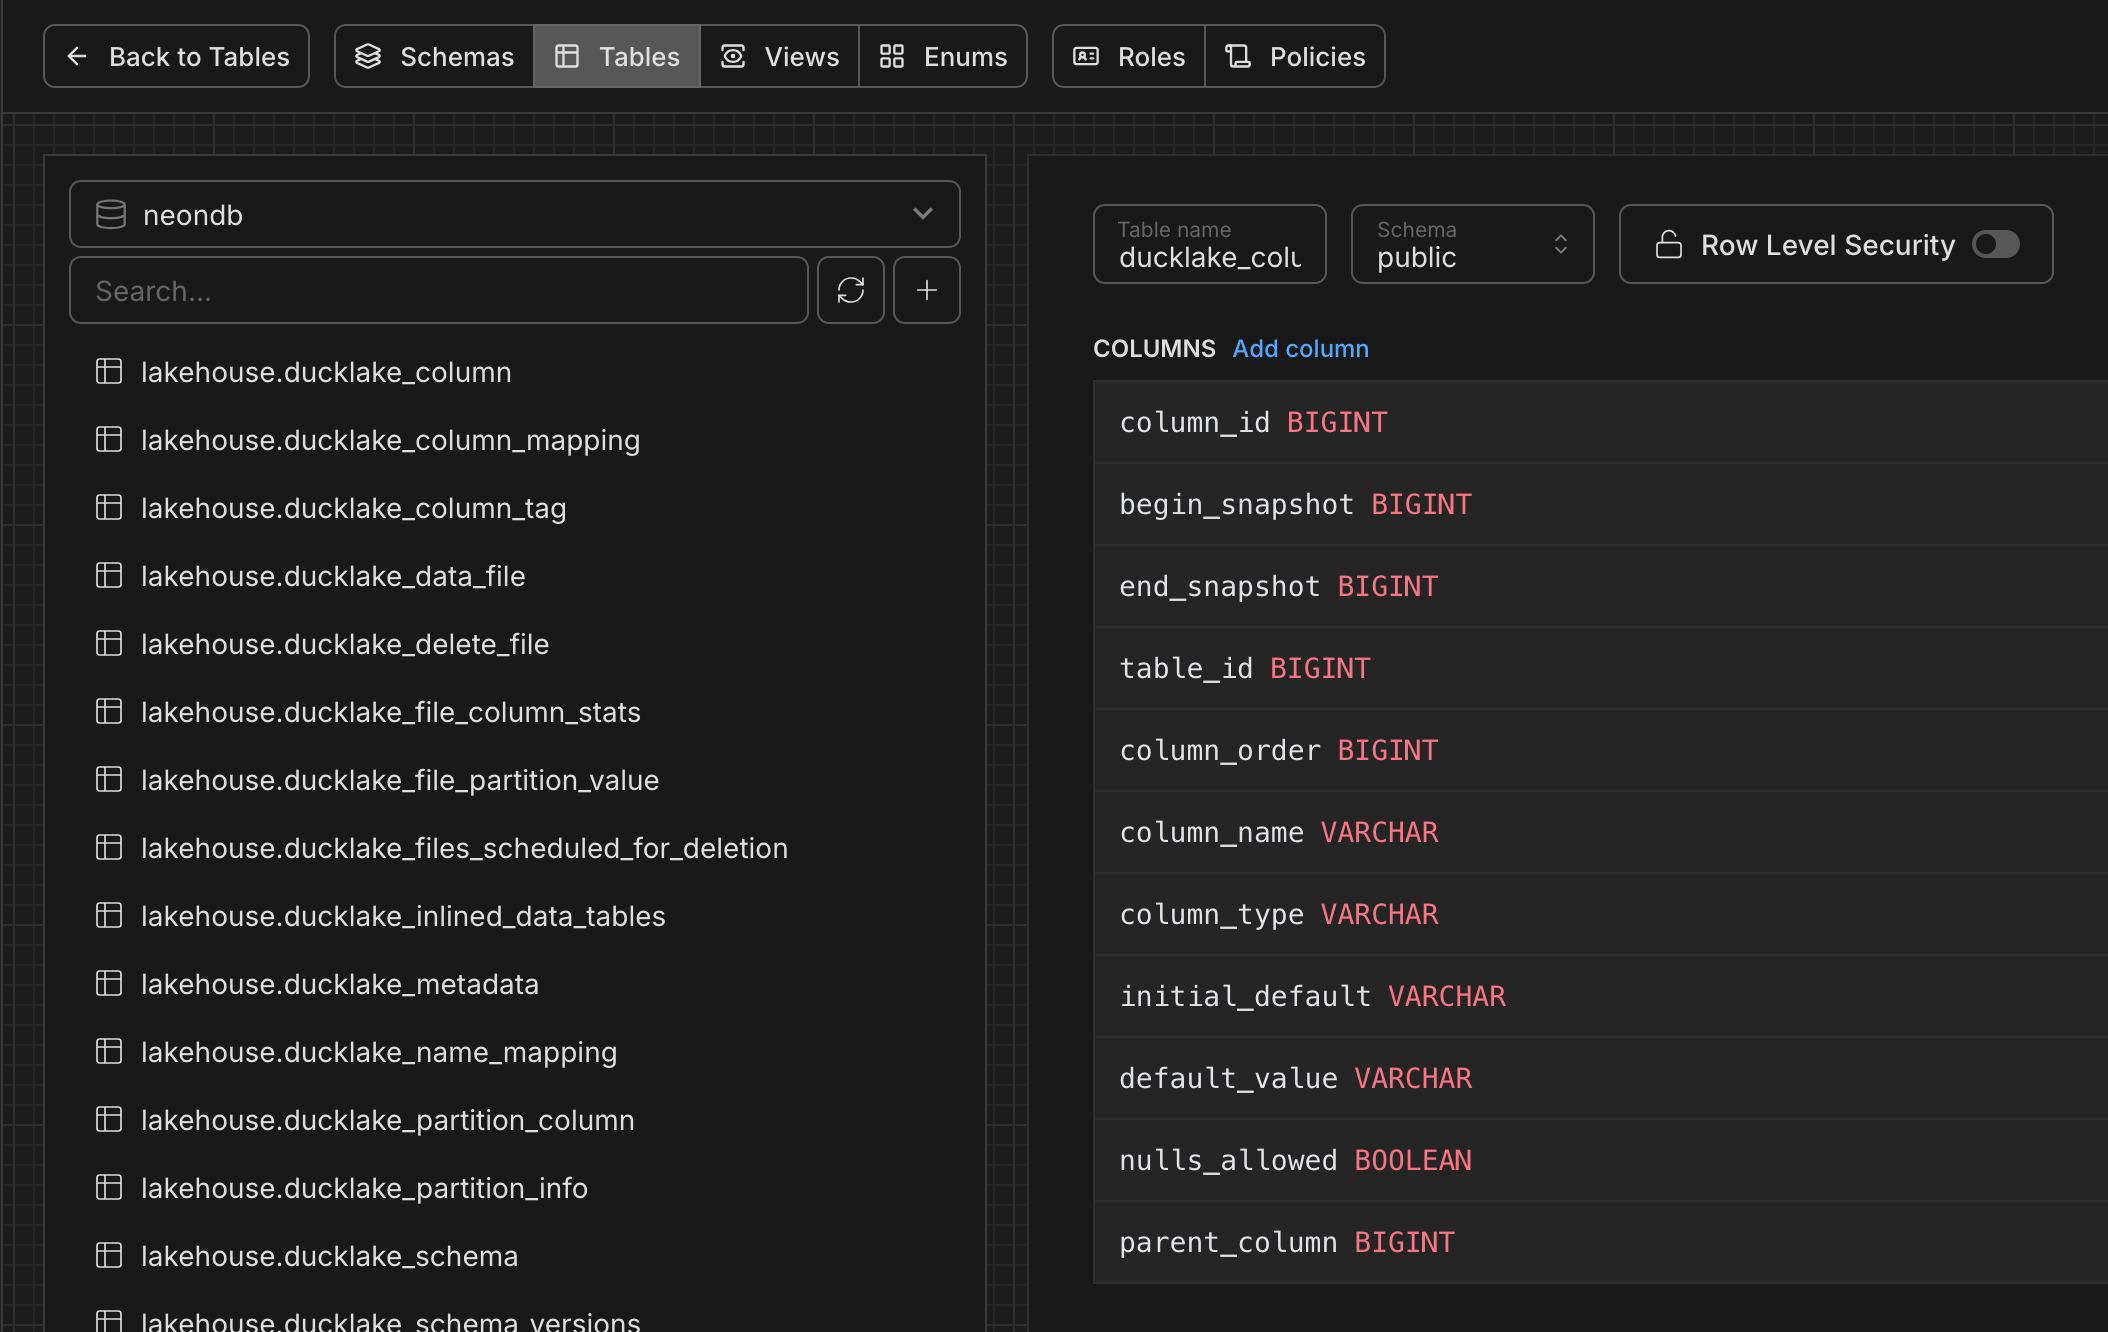
And you can see the DuckLake metadata is stored in your Posgres db with all the snapshots and details:
Easy enough? Now, let’s see how we can take this data and use SQLMesh for modeling and transformations.
Data Transformation
I picked SQLMesh for this project mainly because it’s the best dbt alternative on the market, and I feel its features are richer than dbt-core (I’m a big fan of SQLMesh). If you haven’t used SQLMesh before, you may want to check out my getting-started guide.
A good thing about SQLMesh is that you can work with DuckLake out of the box. Also, building a system with ephemeral compute is a breeze in SQLMesh as it works natively with engines like DuckDB. You can even build Python models without a Python runtime in your warehouse. In essence, SQLMesh runs models where SQLMesh runs.
For those Python fans, I built a Python model using Polars that I’ll cover in a minute in this section.
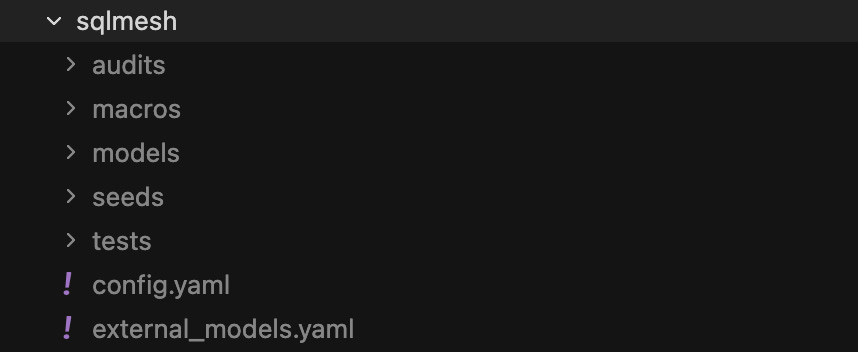
Structure of a SQLMesh Project
The folder structure of a SQLMesh project is pretty much the same as that of dbt. You have folders for macros, models, etc.
External Models (Sources)
One difference might be that SQLMesh manages source model schemas differently. You could just bulk store the source model info in a YAML file. In this project, it’s stored in external_models.yaml. You won’t need to run this command in this project, but if you’re working on your own SQLMesh project, then once you specify source table names in your models, you can run this to auto-generate source schemas:
uv run sqlmesh create_external_modelsThis creates external_models.yaml file with all the source schemas:
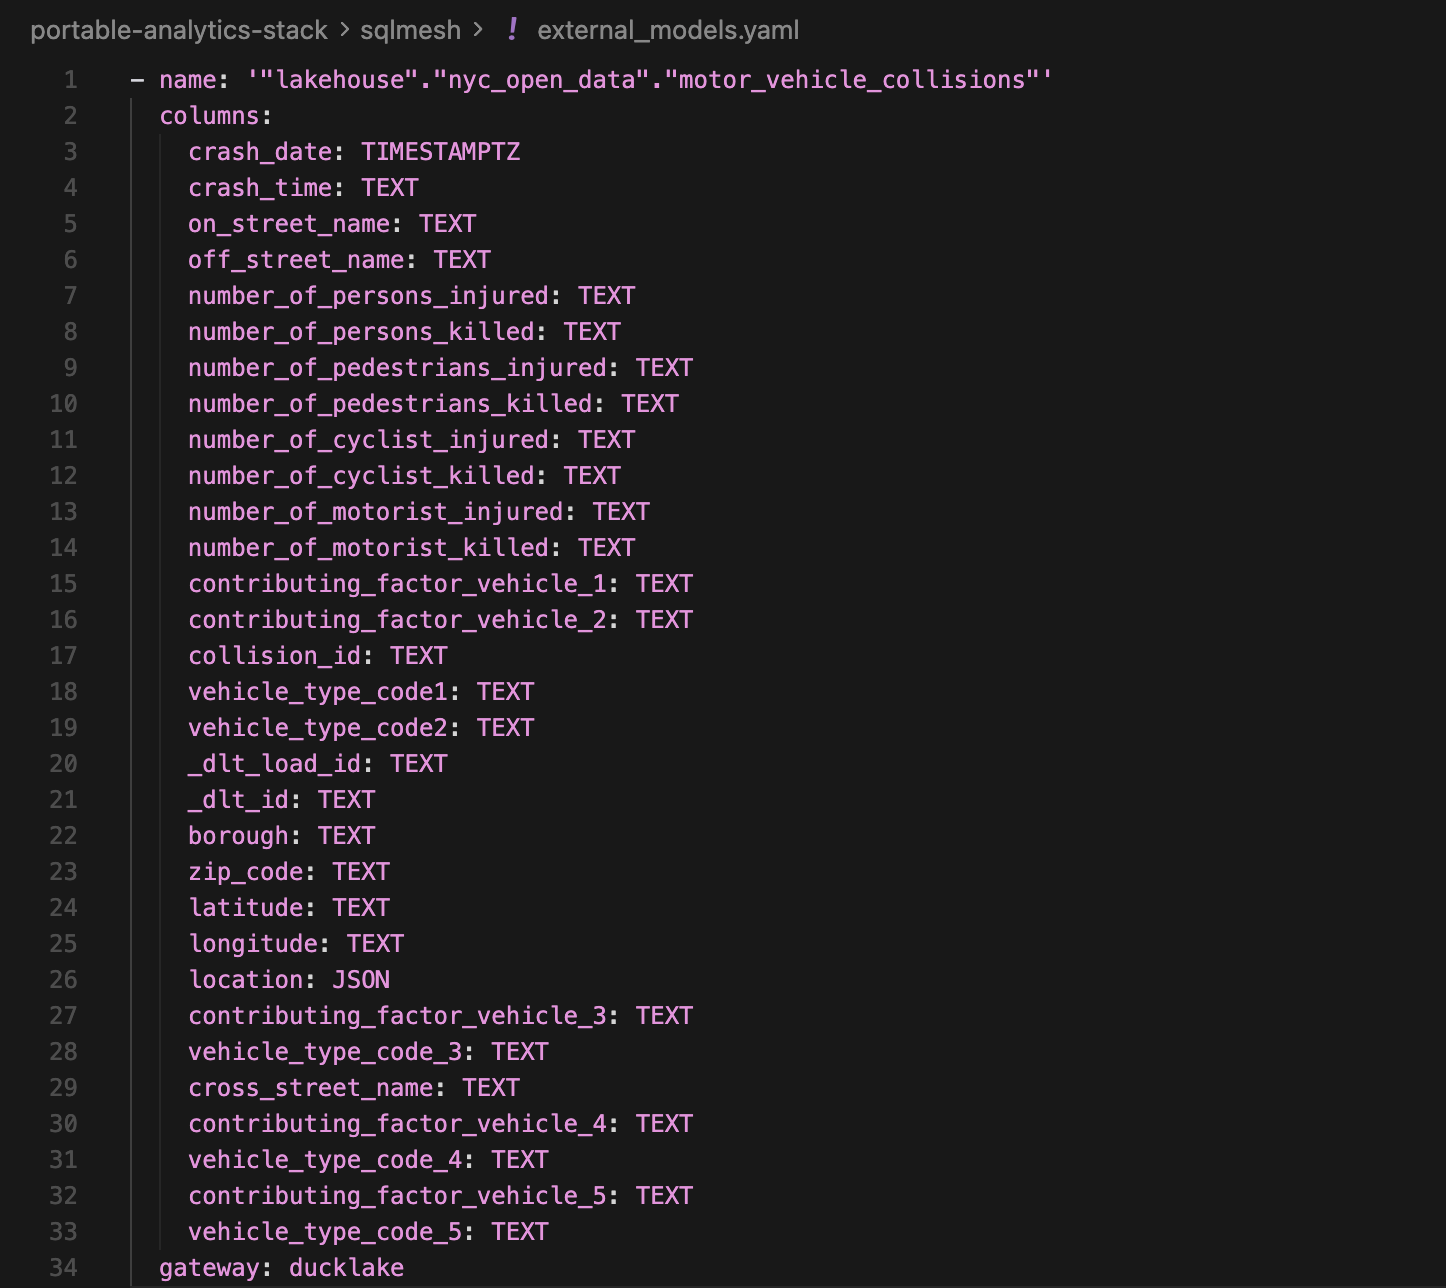
Not to mention you have the flexibility to manually specify each source model schema, and even group models into different yaml files for organization. I just like the fact that it’s so easy to generate source model schemas with just one command and you forget about it.
Executing Models
Let’s review the models we’re building:
Materialized as a view, handling type conversions
Materialized as a table, with incremental logic based on a date field (delete+insertion on recent partitions). This selects a subset of fields that will be used in downstream models.
Materialized as a table, the aggregated data shows important metrics from the dataset.
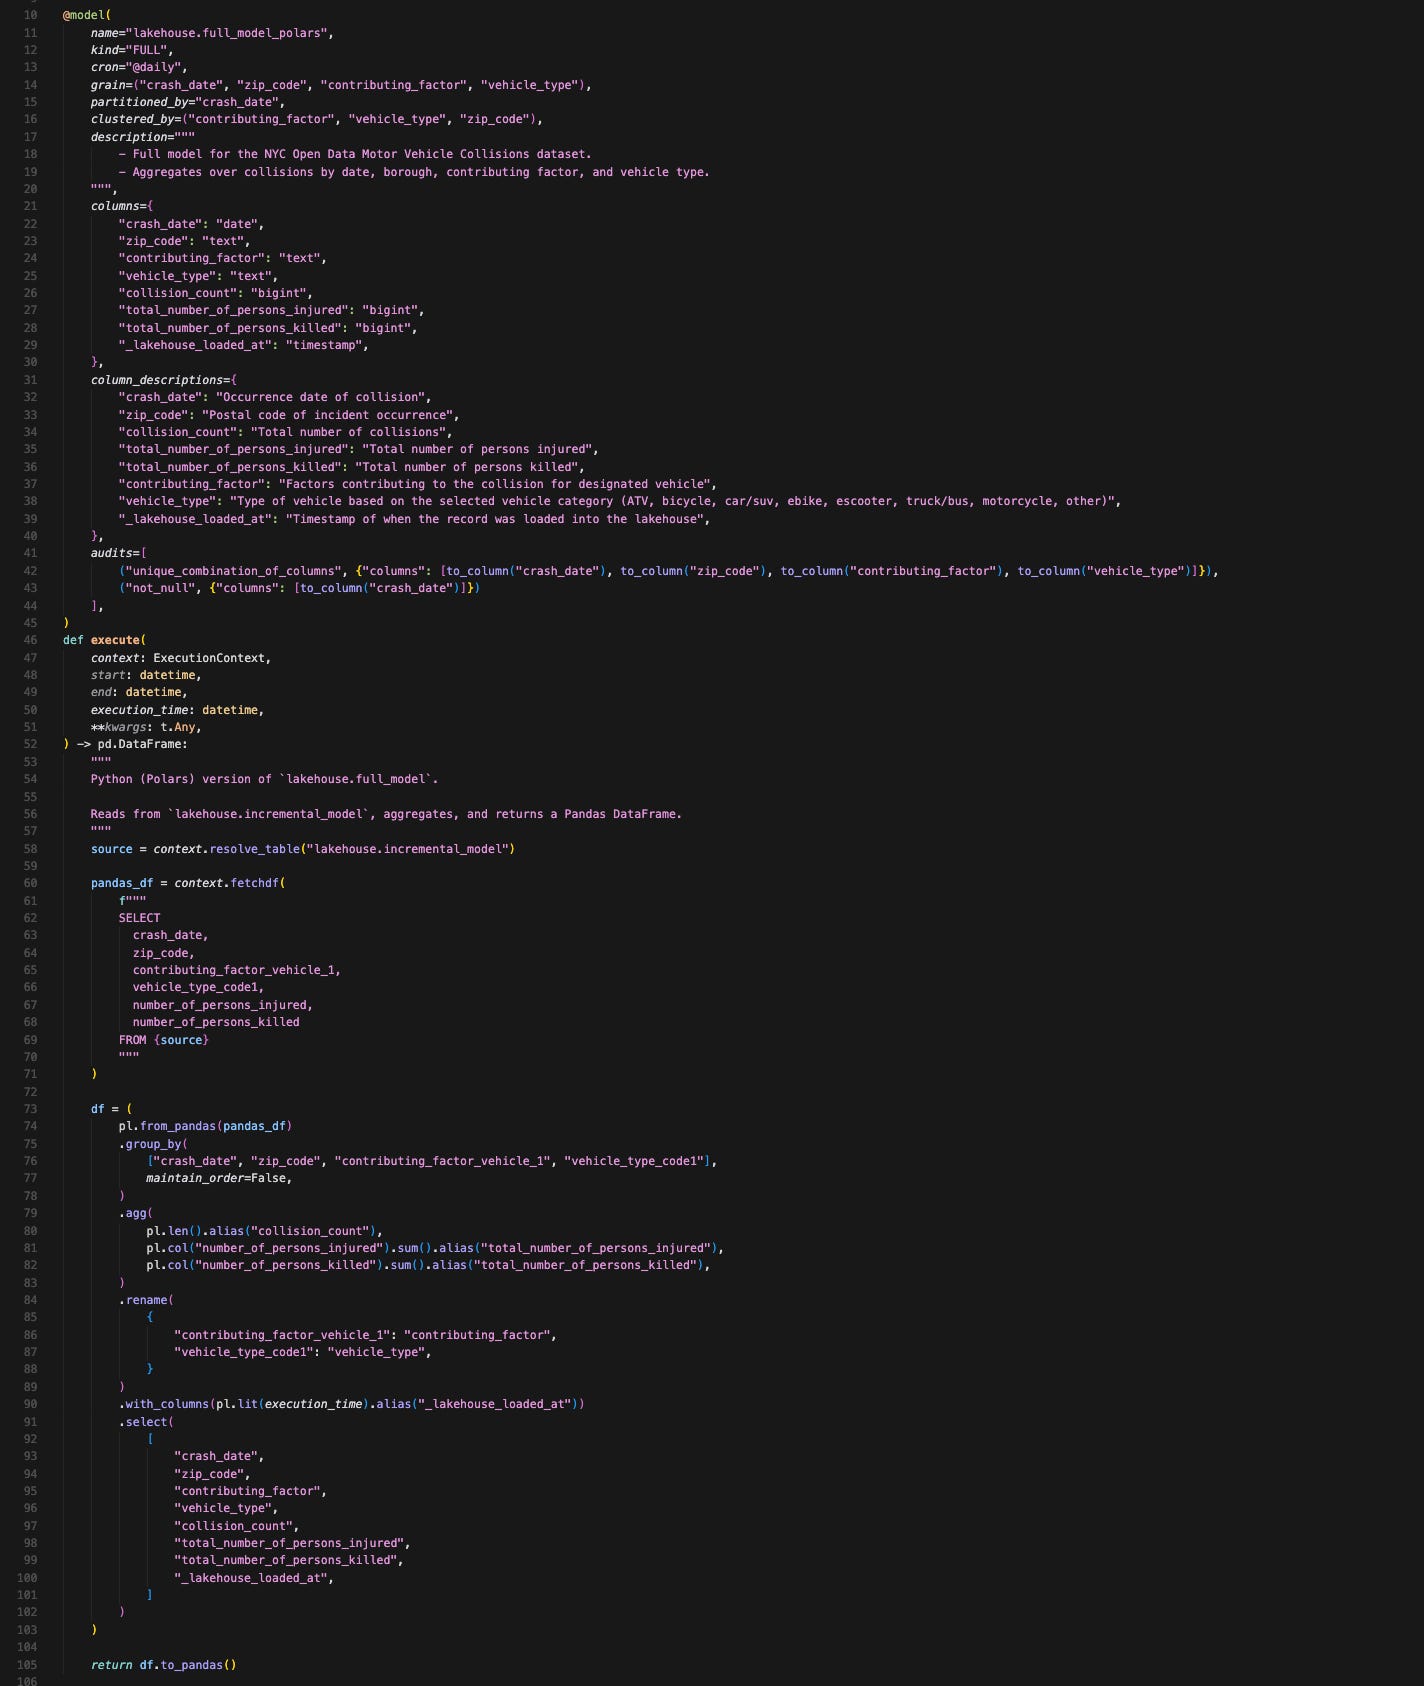
The exact same model is full_model.py except that this one uses Polars instead.
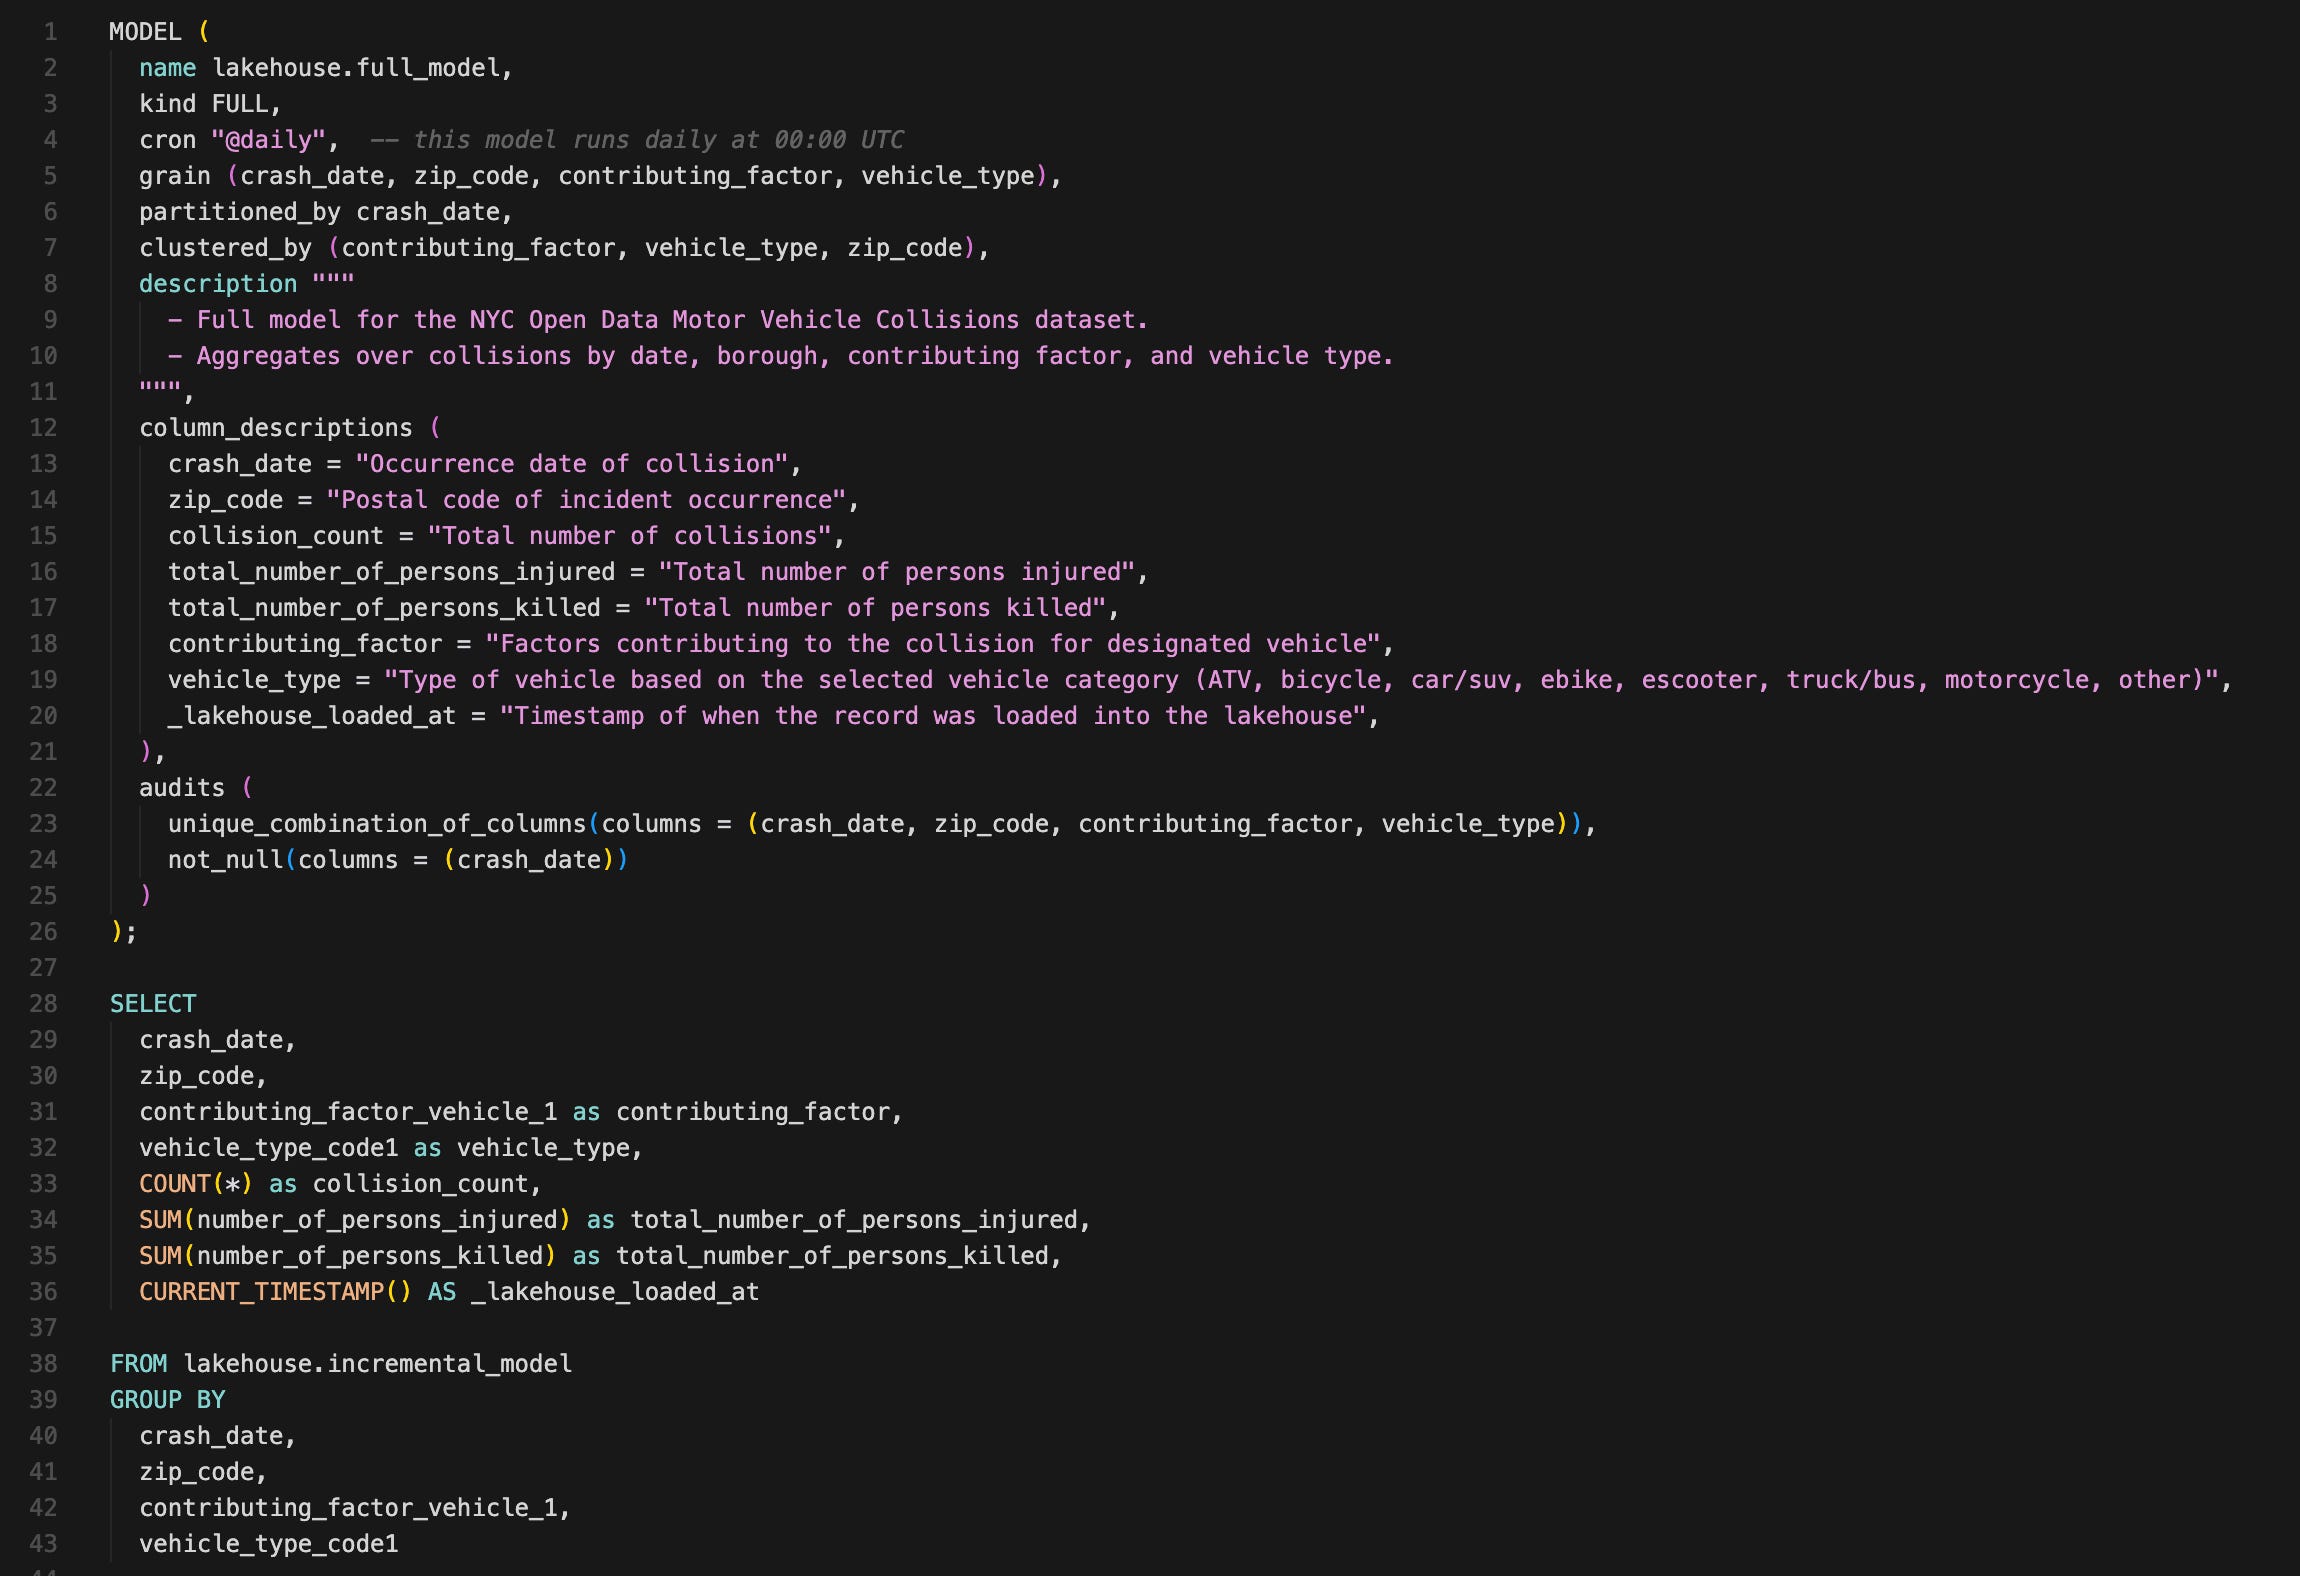
We won’t look at all the models in detail, but let’s take a peek at the two full_models, comparing a SQL model and a Python model:
full_model.sql
full_model_polars.py
(Apologies for a small font in this screenshot)
A few things about SQLMesh models:
You put the model config directly in models. Including data audits (e.g., unique value and non-null value tests). You don’t have to switch between your model and config files.
Python models require a bit more set up compared to SQL models—having to specify column data type mappings (optional in a SQL model) and the way you have to fetch the upstream tables requires a few lines of code.
These additional configurations increased the Python model's lines of code by 3x compared with the SQL model. Obviously, for such a simple model we have in our project, using Python might be overkill.
You can imagine that if your dev team is Python-oriented, they can adopt SQLMesh just fine. And if you want to build data science or predictive models within SQLMesh using ephemeral compute or whatever the Python runtime your warehouse provides, it fully supports that.
One caveat with Python models is that it has to return a Pandas, PySpark, Bigframe, or Snowpark Dataframe. The good news is that you can use Ibis in SQLMesh to give you a bit more flexibility.
Executing Models in dev
Now it’s time to run a SQLMesh command to execute these models (it’d be helpful to read about SQLMesh’s virtual data environments before proceeding):
make sqlmesh-plan-dev # executing models in dev environment
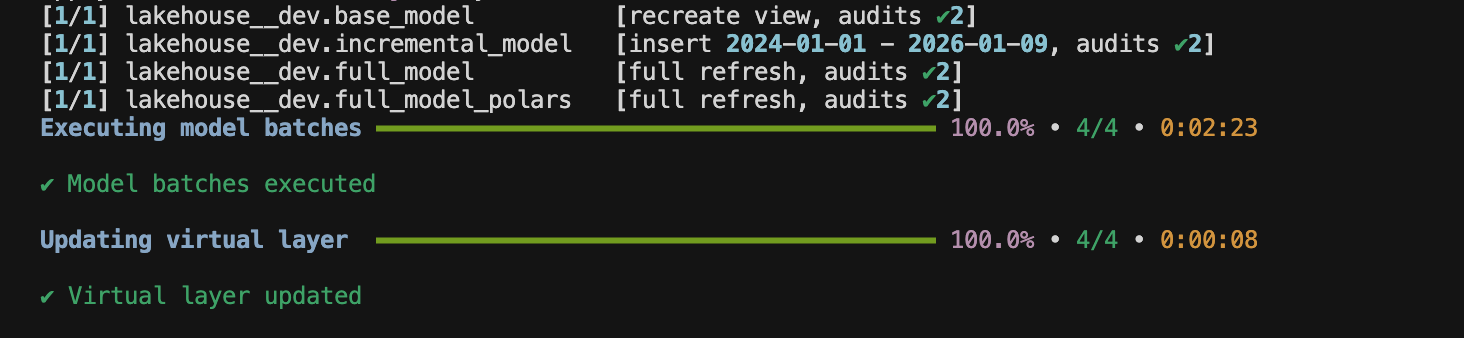
# "cd sqlmesh && uv run sqlmesh plan dev"SQLMesh prints out a plan in the console:
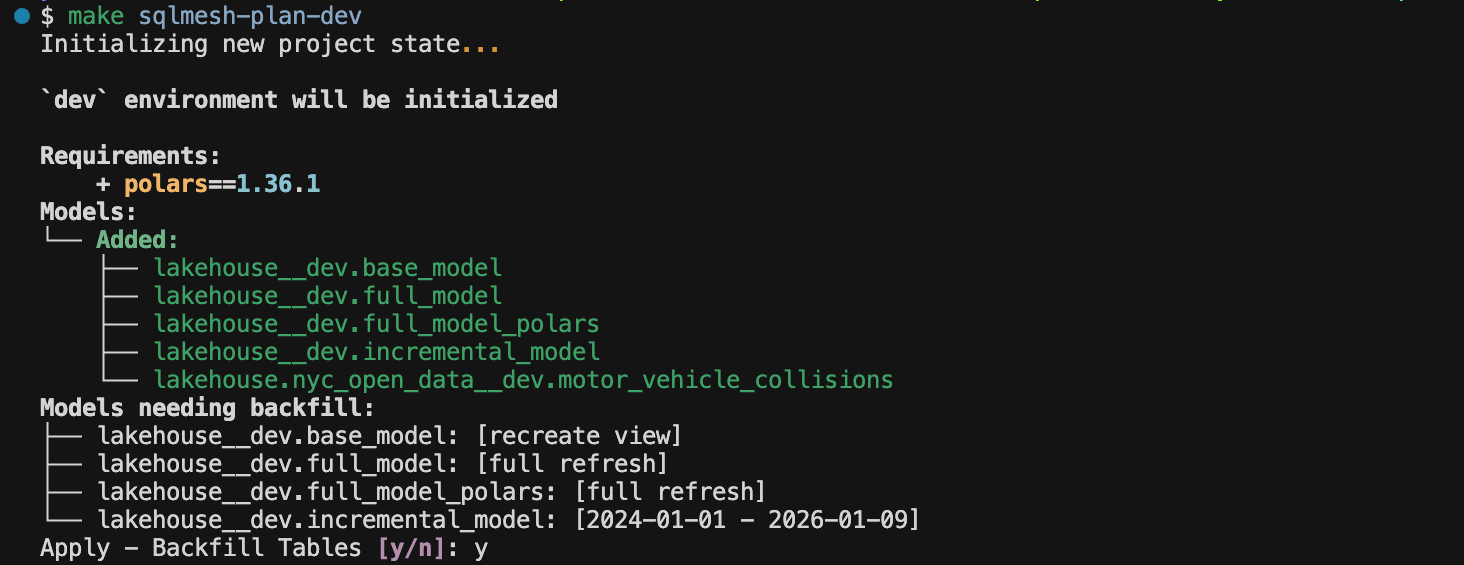
You can approve it by typing “y“, then SQLMesh executes the models:
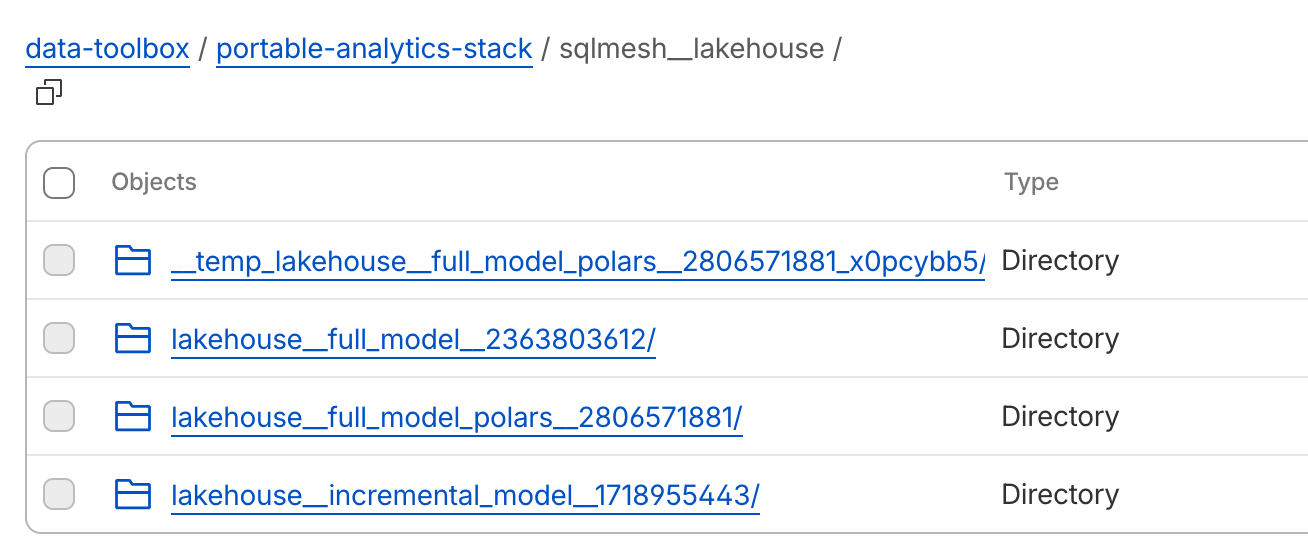
Check out the files outputted into your object storage:
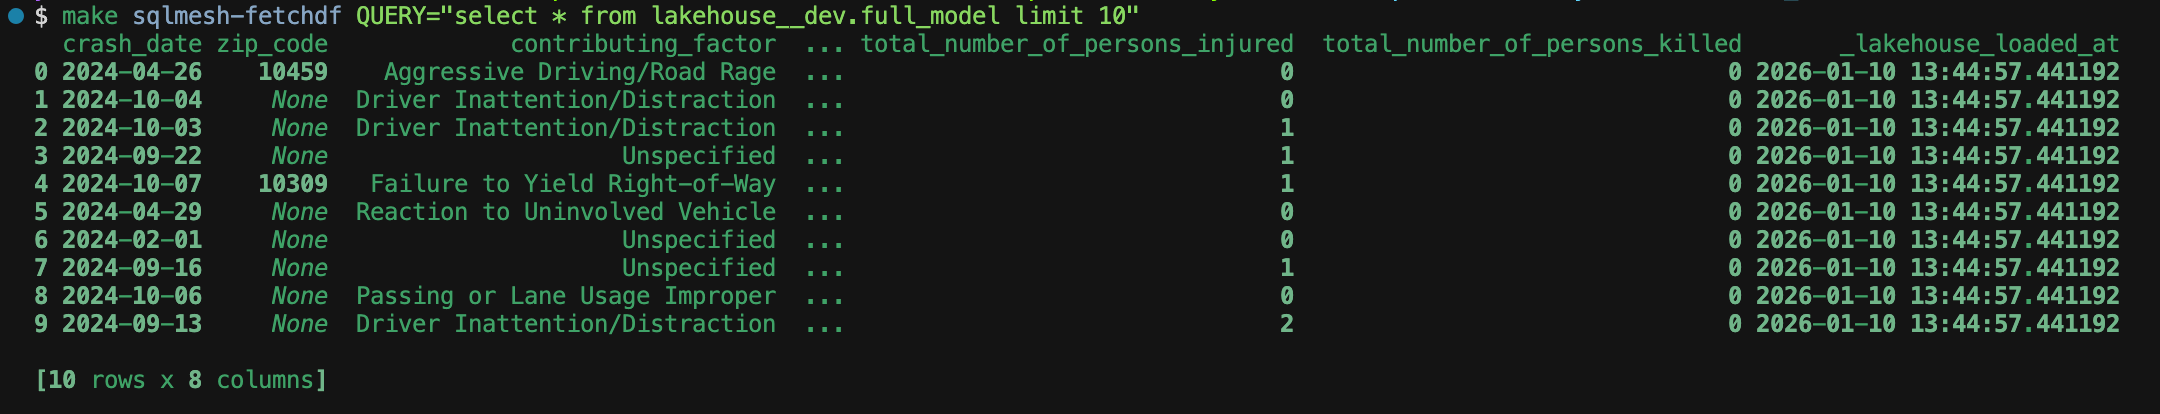
And let’s run the sqlmesh fetchdf command to check the model output right in the console with a SQL query. Adding “__dev“ suffix since I ran the models in an environment called “dev”:
Check Model Lineage
You can look at the model lineage by running the sqlmesh ui command:
make sqlmesh-ui
# "uv sqlmesh ** uv run sqlmesh ui"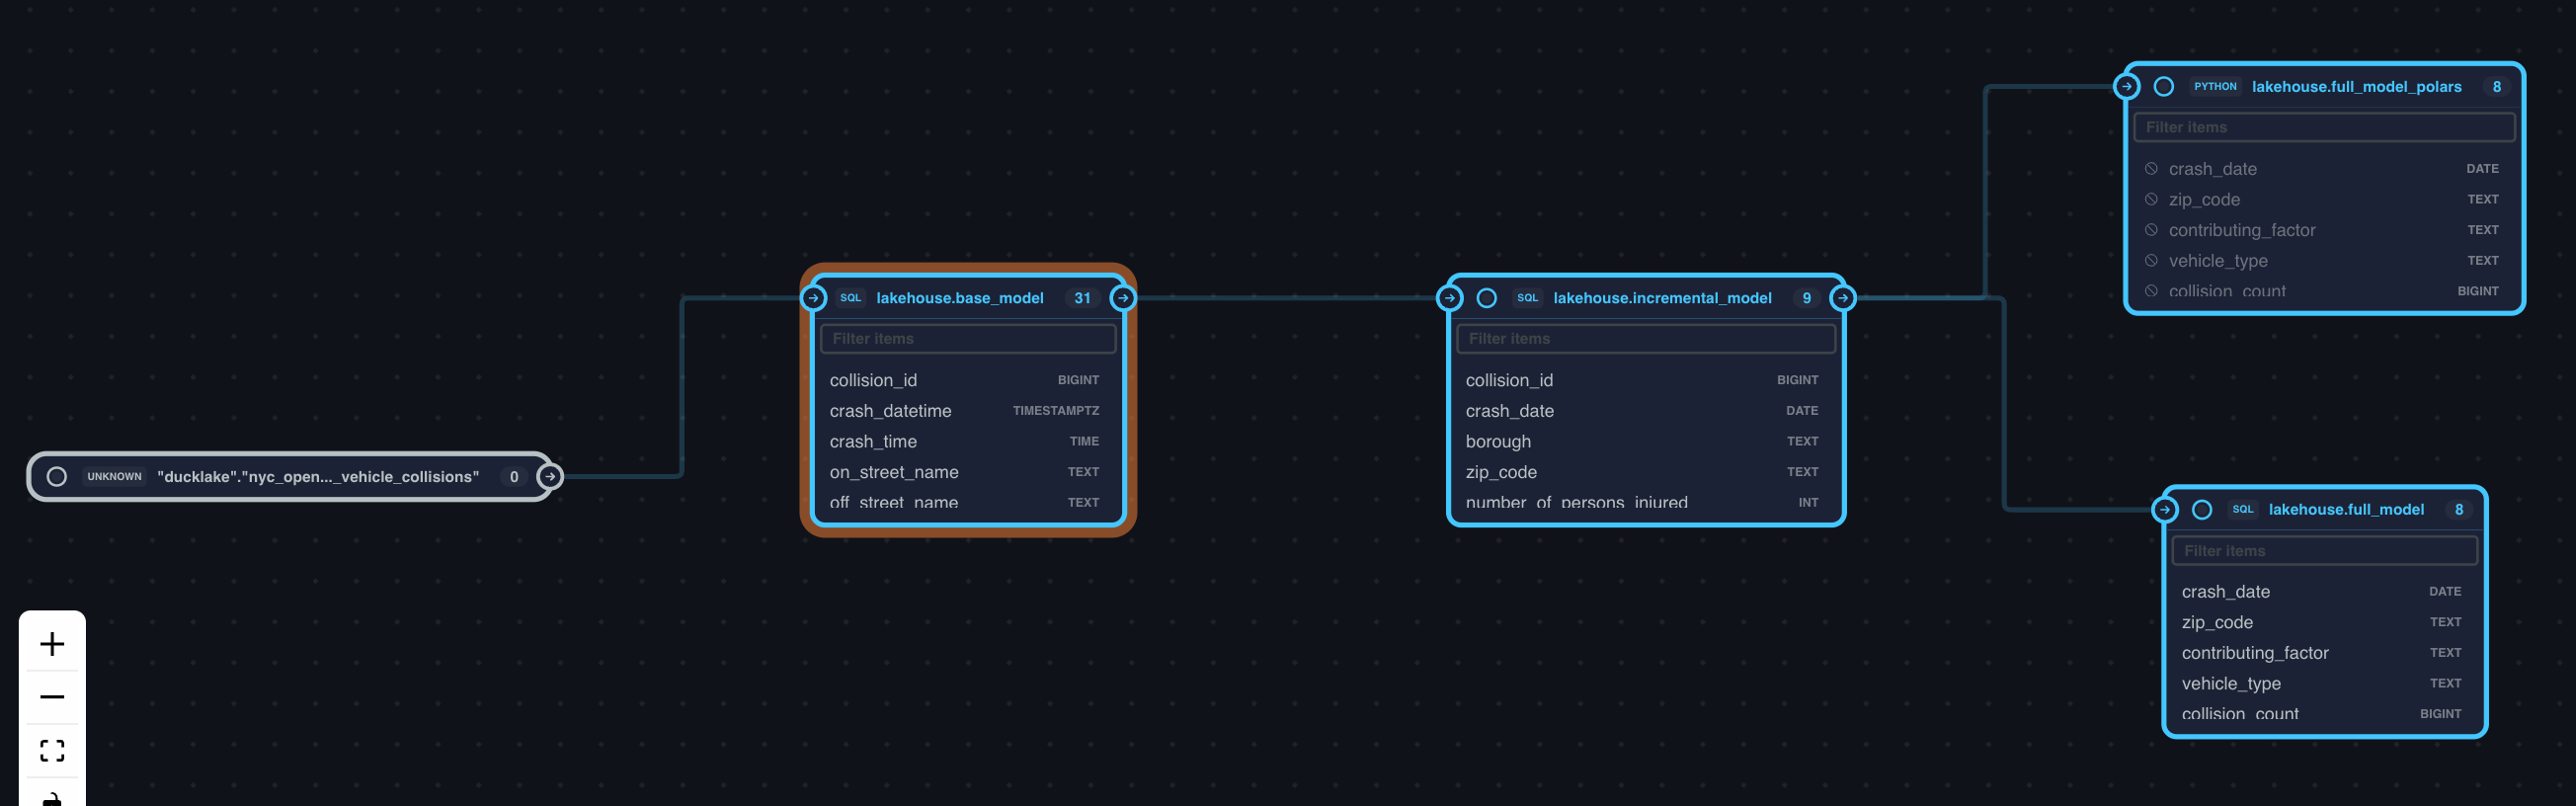
It’s actually the column level lineage you can see in the SQLMesh UI. It’s not behind the paywall, completely free out of the box.
Also, if you prefer, you can even use the SQLMesh UI to develop models. I mainly use it when I need to check the model lineage though. For better or worse, I’m finding the SQLMesh UI less and less useful in my workflow since the introduction of the SQLMesh VSCode extension. Nonetheless, it’s a comprehensive working IDE for SQLMesh.
Speaking of model lineage, one downside of SQLMesh is that it doesn’t have a built-in command to generate the full-featured model docs, unlike you can do with dbt. If you know anybody working on this docs feature for SQLMesh to any extent, let me know. I’m yearning for such a feature in SQLMesh for the longest time.
Execute Models in prod
Finally, let’s run the models in prod and see how SQLMesh’s virtual data environments work.
make sqlmesh-plan  # executing models in prod environment
# equivalent to "cd sqlmesh && uv run sqlmesh plan"
You get a prompt to virtually update your models in prod, and once you confirm, your models get executed in prod:
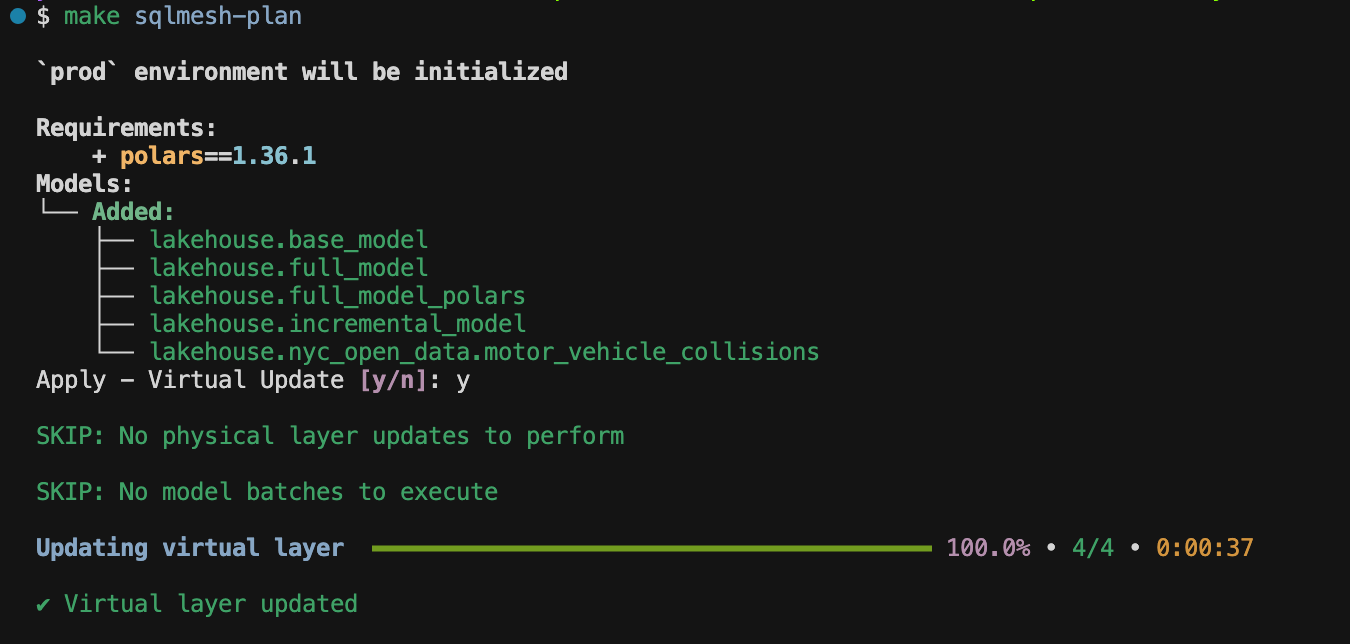
Since everything prod models needed was already in dev, SQLMesh just pointed prod models to dev models, saving compute cost and time. You can imagine this is huge if you project uses a cloud data warehouse like Snowflake, Databricks, or BigQuery.
Summary
In this section, we:
Ran models in dev
Confirmed the executed models
Checked the output in R2
Checked the model lineage through the SQLMesh UI
Ran models in prod
In the next section, I’ll show you how CI/CD and scheduled jobs would work in our setup.
CI/CD and Scheduled Jobs
If you want to test this on your own, make sure to run the following command to export env variables to GitHub secrets:
make set-gh-secretsCI/CD in SQLMesh
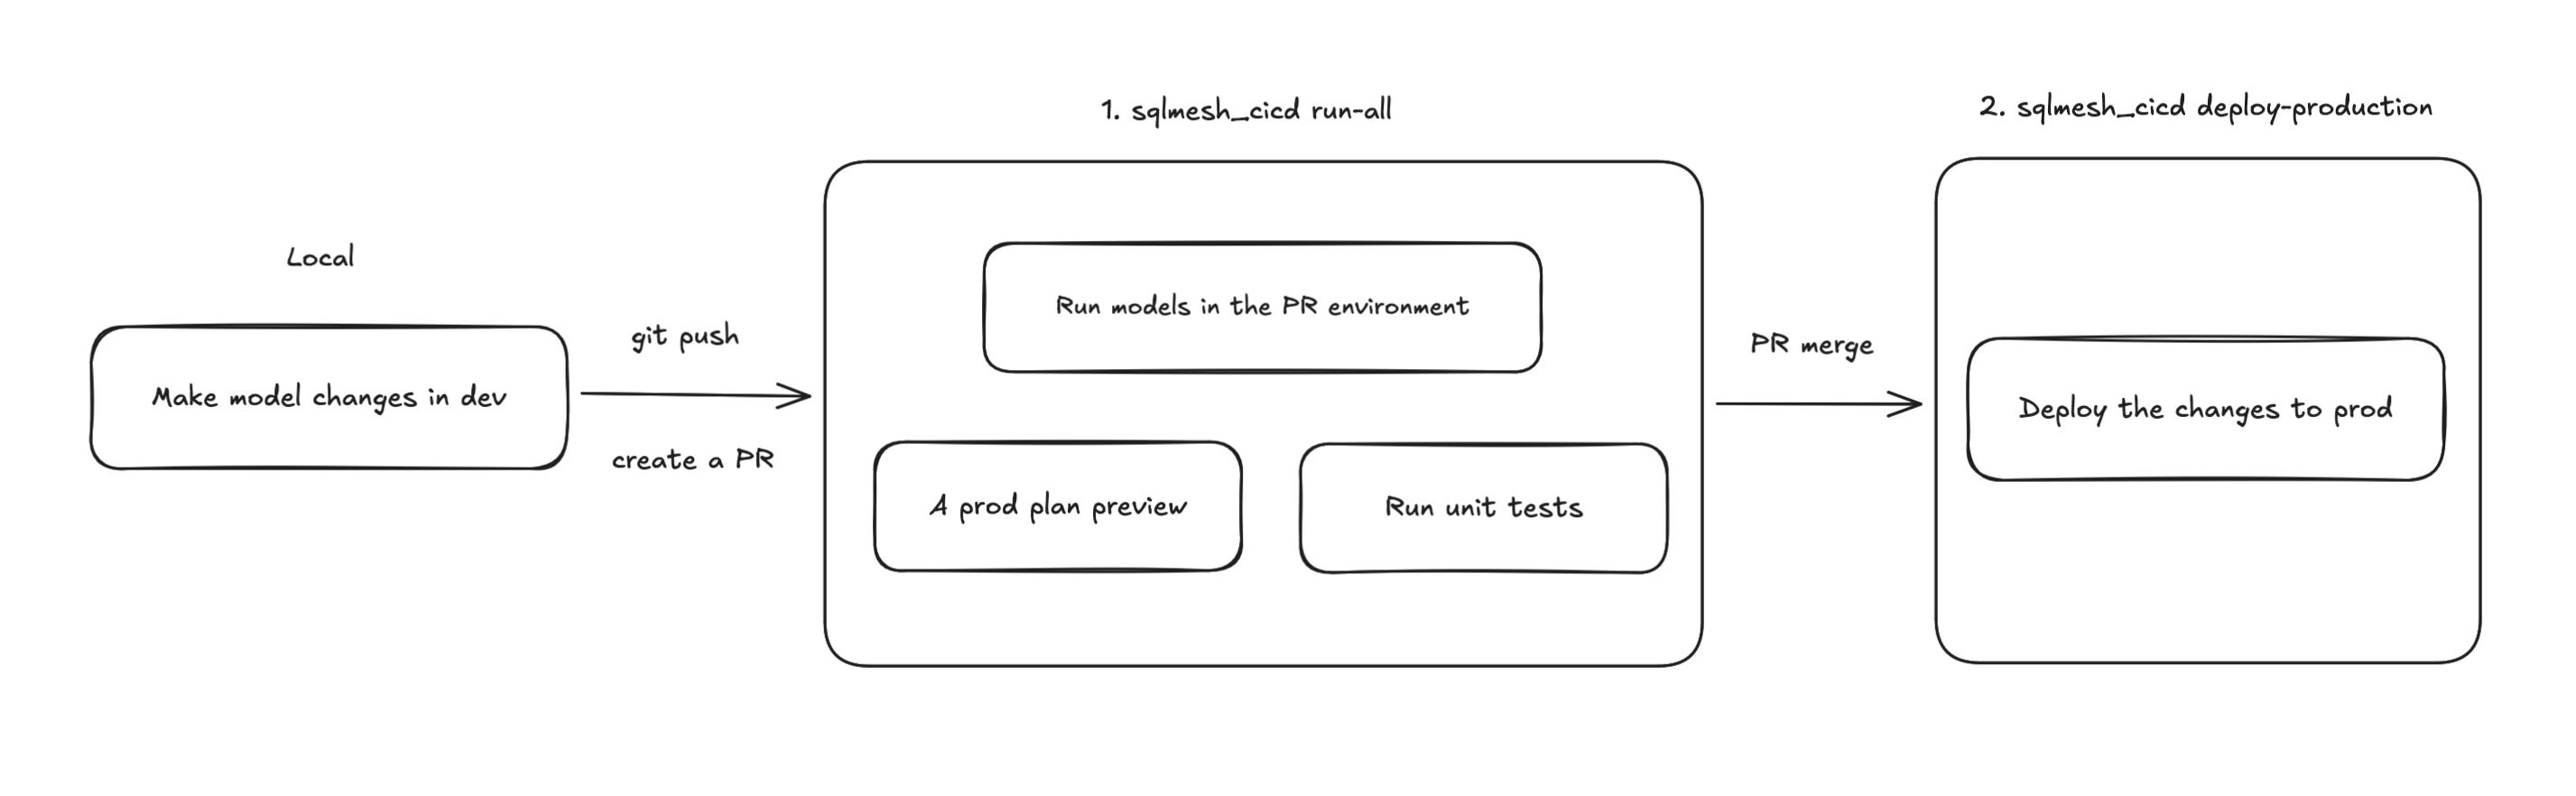
SQLMesh provides an open-source GitHub Actions CI/CD template. It’s really nice that you already have a starting point, and all you need to do is tailor it to your needs. Our SQLMesh CI/CD workflow is defined in .github/workflows/sqlmesh_cicd.yaml.
The SQLMesh CI/CD workflow does 2 things:
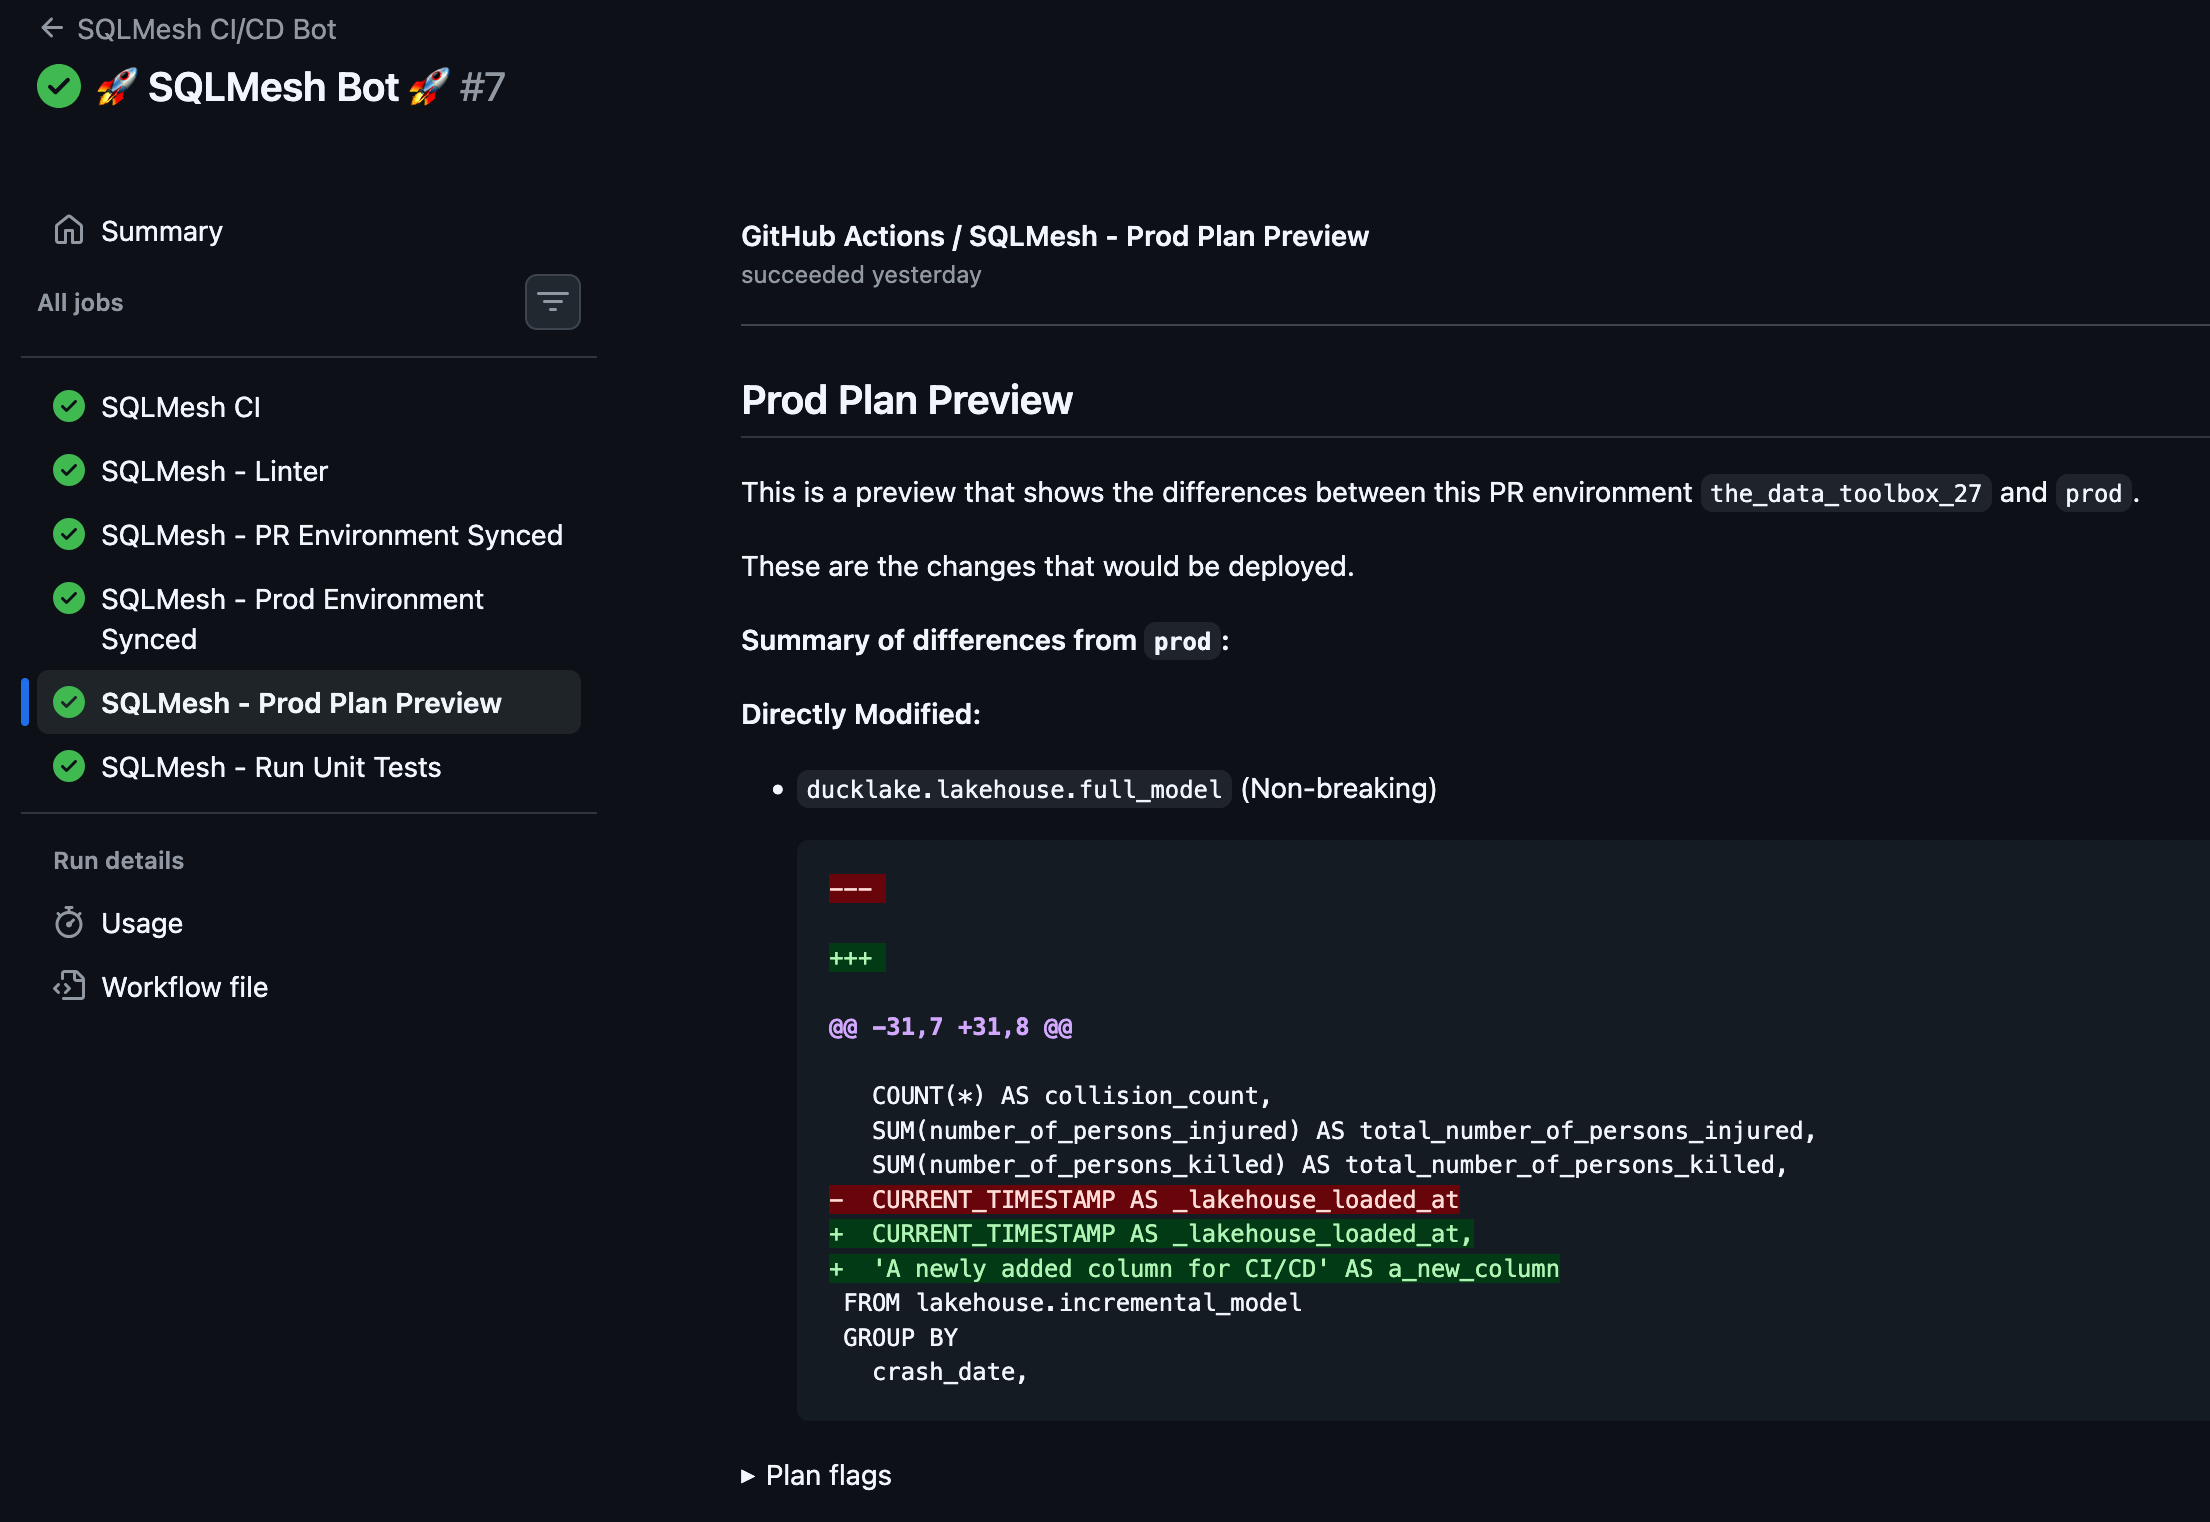
A job runs models in the PR environment and gives you a prod plan preview, showing the differences from prod models.
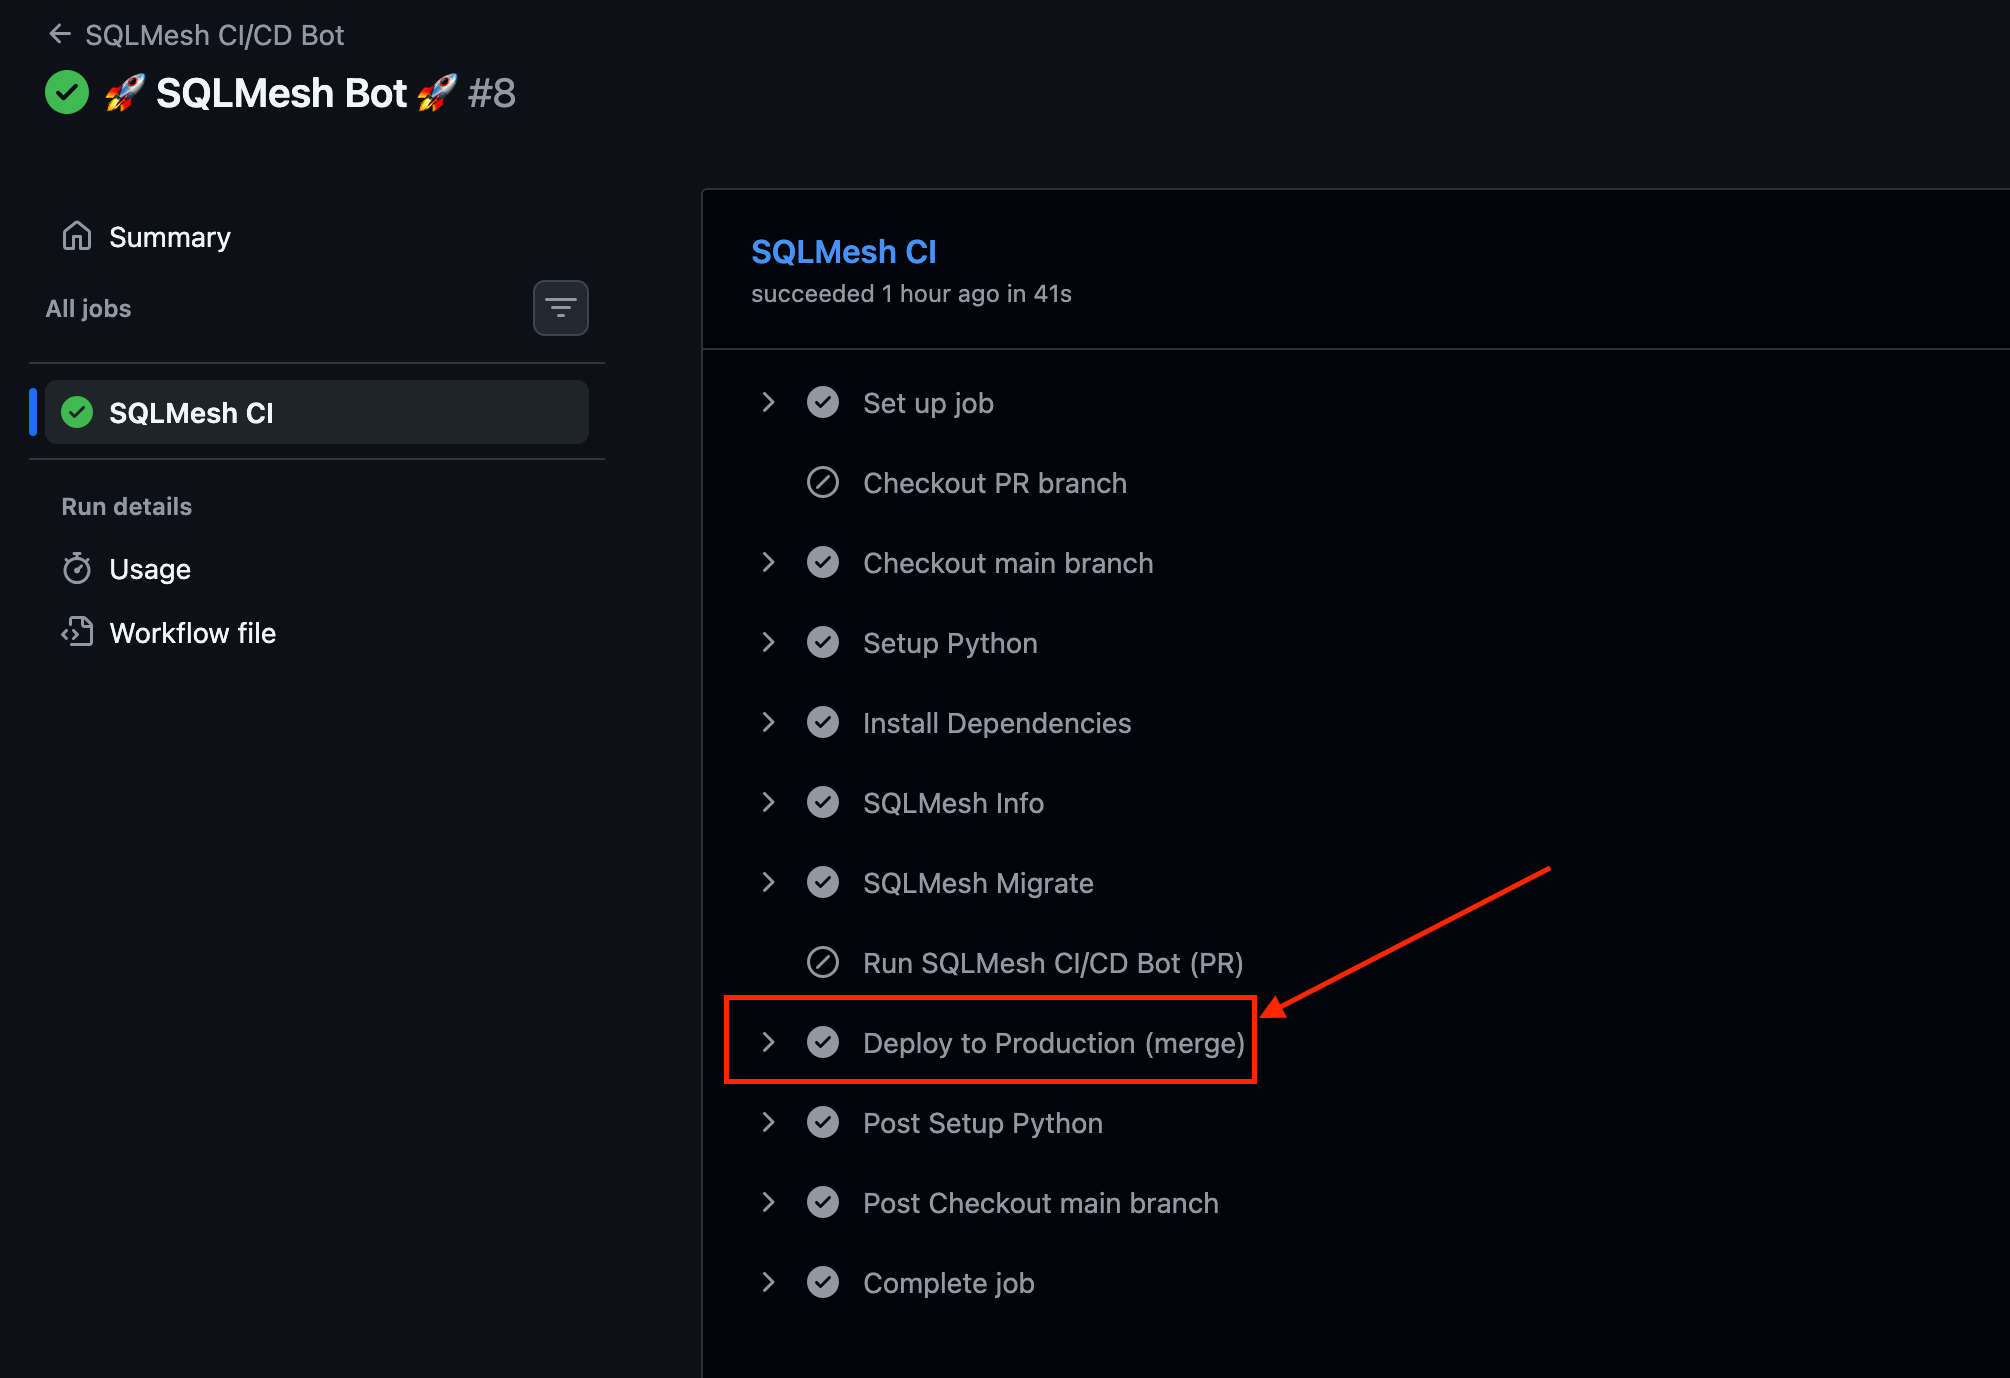
Another job gets triggered, updating models in prod once you merge the changes to the main branch.
I won’t do a detailed walk-through of this SQLMesh CI/CD workflow in this article, but I’ll probably do it in another article in the future.
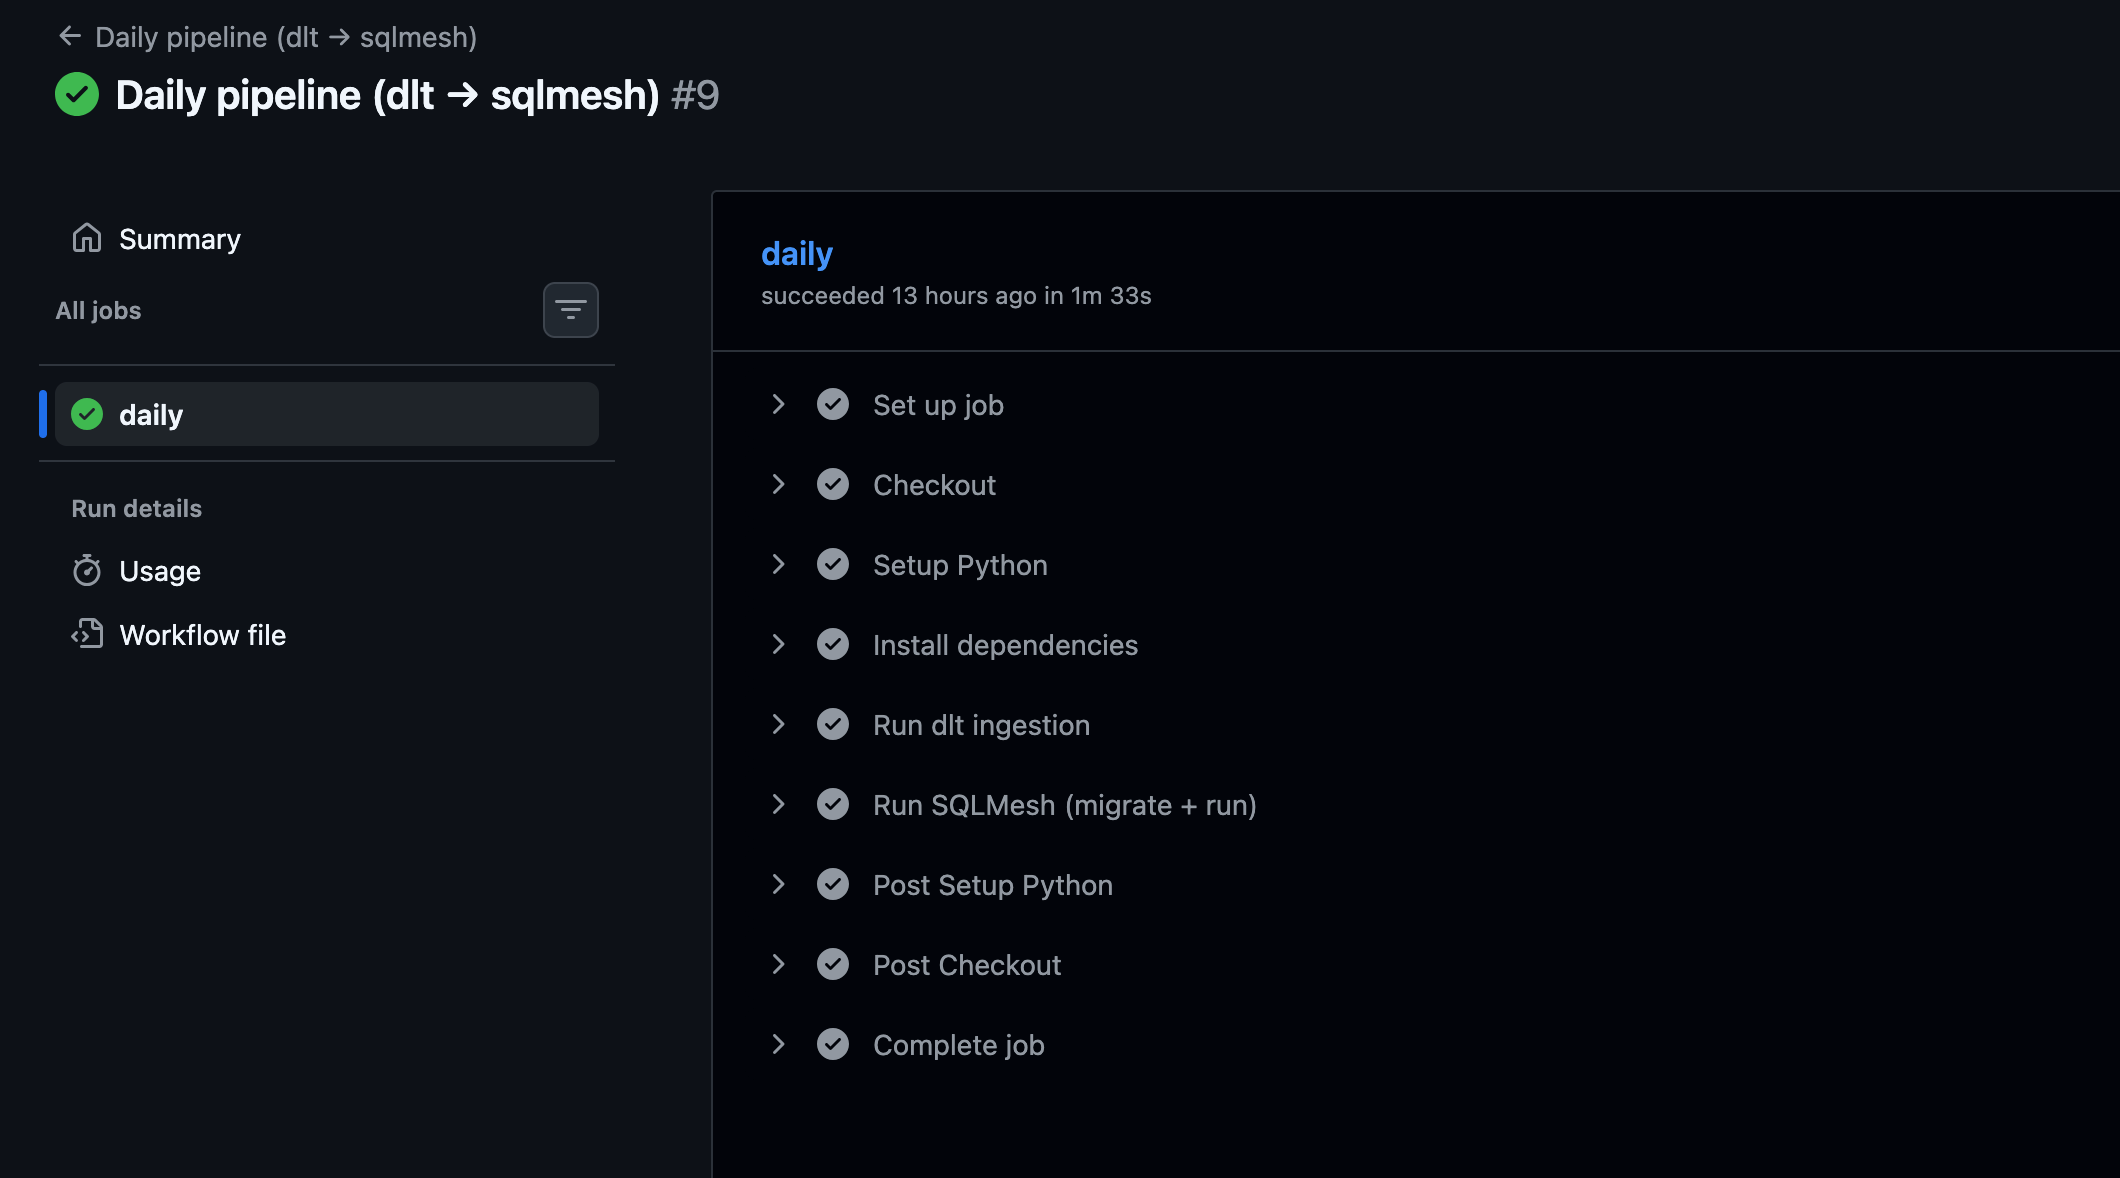
Scheduled Jobs
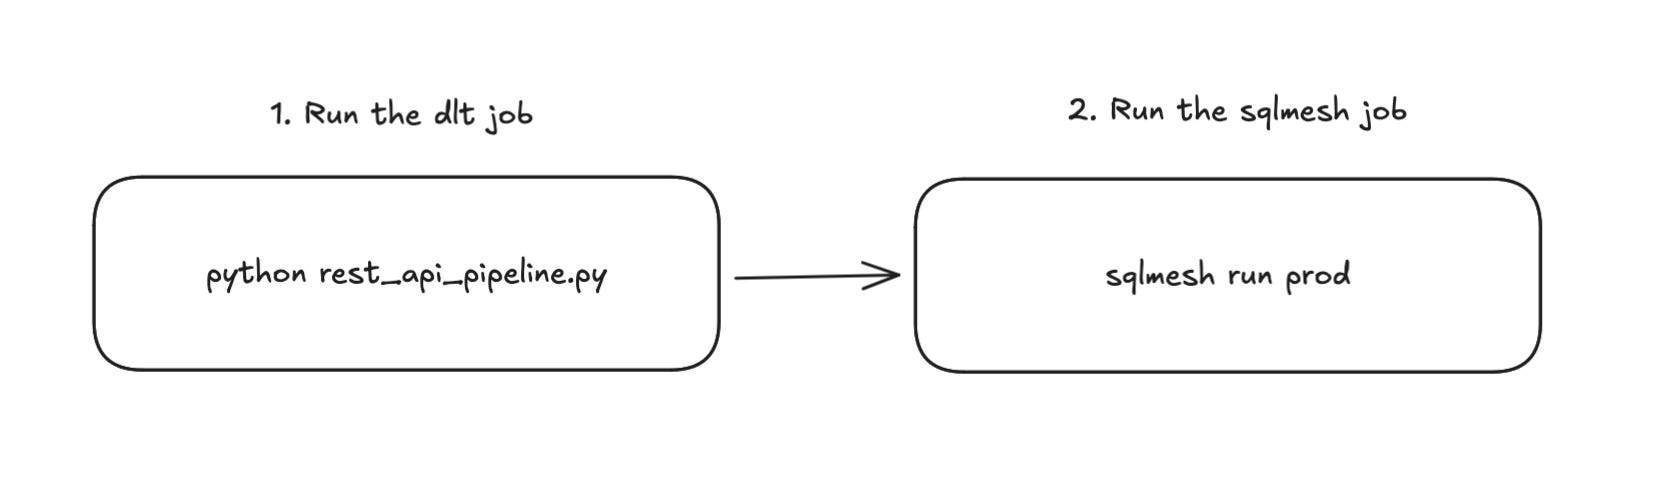
I have a GitHub Actions workflow that does these in sequence:
Run the dlt job
Run the sqlmesh models in prod
For scheduled runs, SQLMesh uses the sqlmesh run command instead of the sqlmesh plan command. The sqlmesh run command performs model evaluation based on the missing data intervals identified at the time of running.
Why Not Using Airflow or Dagster?
I’d say adding a full-featured orchestrator without a clear need is usually a mistake. It tends to introduce unnecessary operational overhead and management complexity you don’t need yet.
Especially early on in a company’s data journey, running jobs on a schedule with something like GitHub Actions, or a serverless job runner like Cloud Run Jobs is often good enough. SQLMesh even comes with a built-in scheduler that can take you pretty far. This setup also keeps things flexible, so you can always add a dedicated orchestrator later if it makes sense.
That said, you’re absolutely free to add an orchestrator to this portable analytics stack if you want. Both Dagster and Airflow have solid open-source projects, along with managed options, if that’s the direction you decide to go.
Serving Layer
This portable analytics stack has a missing piece—the serving layer. It can be a challenge to implement a full-featured BI tool on top of an analytics stack that relies on ephemeral compute. But there are a few options you can go with:
Use something like Streamlit, Plotly, or Evidence.dev, with DuckDB to query data from DuckLake.
Set up a process to export models to a warehouse like Postgresql, Snowflake, or BigQuery.
Use MotherDuck entirely for compute and storage.
Option 1 might be the only way you can build a serving layer with this portable analytics stack as is, which may be sufficient for many analytics use cases. I’d say options 2 and 3 are more of an extension or an evolved state of the stack.
Have you seen other setups for the serving layer with ephemeral compute? I’m curious to hear about what others have done in this kind of setup.
Conclusion
Many people talk about shiny, cool data tools, but only a few explain how to actually use them to build a usable analytics stack. After reading this, I hope you now have a clear picture. You can take what I built and adapt it to your own needs, or you can choose your own tools to build a portable analytics stack (in fact, I might swap SQLMesh for dbt in a future article).
A portable analytics stack is built on tools that are accessible, affordable, and scalable. If your organization is small and just getting started with data and analytics, building your stack around the tools used in this article can be a great starting point.
You avoid vendor lock-in, complex infrastructure, and unpredictable costs. A portable analytics stack gets the job done today and still gives you the flexibility to grow and evolve in the future.
 | A guest post by
|
🙌
This is an enjoyable article to read and gives fresh ideas on how to build a data stack that is flexible and emphasizing on great dev experience. Thanks for sharing!