

Databricks Semantic Layer: Metric Views
to the moon

This isn’t the first time I’ve written about that ever elusive Semantic Layer, that Death Star of analytics and data platforms, sucking in all calculations into a single spot. For anyone who’s spent some time around Data Platforms and Analytics, the pain of scattered, but important logic, is real pain.
Since time immemorial, data folks of all shapes and sizes have fought their way through a maze of GitHub repos, Confluence pages, and random scripts … in search of all the places that calculate x, y, or z.
One would think we’ve learned our lessons over the decades, but sadly, we are human, and to err is human.

I’m not here to tell you what to do or not to do. Semantic Layer, or Semantic Layer free Data Platform, that’s up to you. If indeed you’re tired of all the scattered business logic and calculations that never align or agree, and you want a solution … I give you Databricks Metric Views.
This issue is sponsored by Thesys Agent Builder
It helps support his Newsletter by clicking the link below and supporting our generous sponsors who make this content possible.

- No SQL.
- No dashboard building.
- No text-heavy LLM responses pretending to be analysis.
Thesys Agent Builder lets you upload a CSV/XLSX (or connect your database), ask plain-language questions like:
“What are the top-performing regions this quarter?”
“Compare this month’s revenue to last month.”
And it responds with actual visual insights—bar charts, tables, summaries, not paragraphs. You can even generate presentation-ready reports and slides from the conversation in one click.
It’s a shift from dashboards → conversations.
From static reporting → generative UI.
From text answers → visuals you can act on.
If you’re building with data but tired of navigating dashboards or writing ad hoc SQL, this is worth a look.
Try Thesys Agent Builder — build your own data insights agent in 5 minutes.
All hail the Semantic Layer
I know when to say Uncle, you know what I mean. Sure, one can be a skeptic about this or that marketing schemes, but we have to take out the lumps, too. One can’t be too sure what will stick in the craw of the CTOs and Data Power Brokers, and be force-poured down the throats of unsuspecting Data Engineers.
No one fully agrees on what it is — but everyone seems to be selling one.

You compare how major vendors define the Semantic Layer:
- Databricks positions it as something that sits after data lakes/marts but before BI tools.
- DuckDB describes it more simply as something that sits after the database but before the business user.
- Snowflake actually ships a concrete implementation via “Semantic Views” — schema-level objects that define business metrics and entities.

The only consistent agreement across vendors:
- It sits between data and end users.
- It standardizes metrics and definitions.
- It often includes governance and permissions.

Sometimes includes transformations. Beyond that? Definitions diverge.
Anywho, if Databricks believes in the Semantic Layer, I might as well hitch my wagon to that horse. I try not to bite the hand that feeds me; I can read the handwriting on the wall.
The concept(s) at the core of the Semantic Layer are indeed on the high moral ground.

No matter how you dice it, code bases … human or AI developed have a tendency to fall prey to loose structure over time, sprawl overtakes, things get dirty and loosey goosey. Databricks Metric Views, as a Semantic Layer, aim to address that problem straightforwardly.
Nuts and bolts of Metric Views
Let’s just get to it and poke a stick into Metric Views and see what crawls out. It might be fun, or boring, but you know, that’s life. I think it’s important for all of us, at the very least, to understand what features and options are available to us as builders of Data Systems and Platforms.
You don’t know what you don’t know, and learning and knowing is half the battle. It’s good to practice our systems design and ensure our knowledge is up to date with the real world. This makes you different from Cursor or Claude spewing out bits and bytes. So, let’s understand Metric Views from the viewpoint of the Semantic Layer.
Here are some basic facts about Metric Views in Databricks.
Built-in materialization if desired
SQL based
Supports complex JOINS
The source can be a view, a table, or a SQL query
Lineage available via the UI (what’s using the Metric View)
Manage Permissions on Metric Views
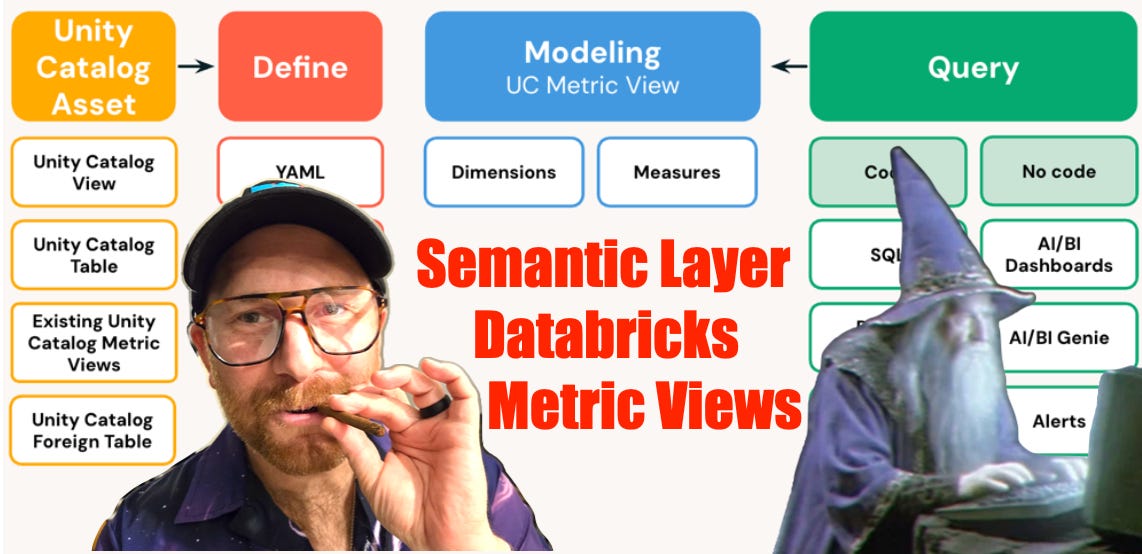
Metric Views in Databricks are first-class semantic-layer objects that live in the Unity Catalog. They let you define governed, reusable business metrics and dimensions once, and then query them consistently across tools such as SQL, BI dashboards, and AI/BI experiences.
They represent business logic and key performance indicators (KPIs) in a way that’s semantic (business-meaningful) rather than purely technical.
Metric Views are stored in Unity Catalog and behave like views, but with enhanced semantic structure and metadata.
Nothing other than what you would expect. I guess the key would be understanding the materialization options, knowing that by default, the query behind the Metric View would have to be recalculated every time someone hits it. But if you are a SQL person, you are well familiar with Views and their ups and downs.
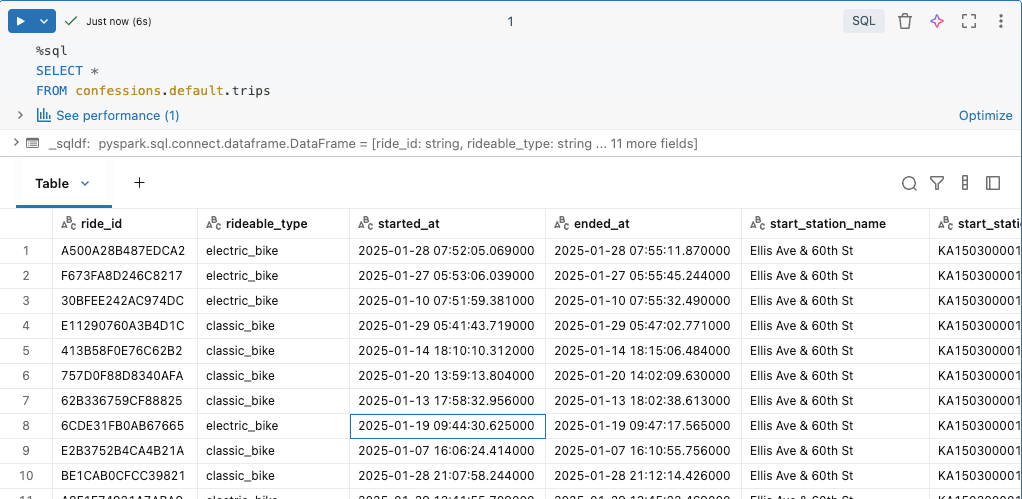
Let’s make our own Metric View with Divvy Bike trips. This dataset contains a bunch of bike rides people took in different cities, along with their start and end locations.
So, as per normal, any sort of Semantic Layer is really about Analytics, with a capital A. That is the whole point: capturing business logic in a single spot for reuse.
Of course, with Metric Views and Databricks, we get a whole host of features that come with Unity Catalog … permissions, who can do what, governance, lineage of usage and change tracking, and access to different Metric Views. This, of course, is a bigger deal, the larger the organization.
Let’s make a Metric View based on our raw bike trip data, just to see how easy it is.
My first Metric View might not be what you're expecting; that is on purpose.
CREATE OR REPLACE VIEW confessions.default.trips_metrics
  (ride_date COMMENT 'Date of trip (from started_at)',
   ride_month COMMENT 'Month bucket (from started_at)',
   member_type COMMENT 'member vs casual',
   rideable_type COMMENT 'Type of bike/ride',
   start_station COMMENT 'Start station name',
   end_station COMMENT 'End station name',
   route COMMENT 'Start → End route label',

   total_rides COMMENT 'Total rides',
   member_rides COMMENT 'Rides where member_casual = member',
   casual_rides COMMENT 'Rides where member_casual = casual',
   avg_trip_minutes COMMENT 'Average trip duration (minutes)',
   total_unique_start_stations COMMENT 'Proxy: unique start stations',
   total_unique_routes COMMENT 'Proxy: unique routes (start→end)')
  WITH METRICS
  LANGUAGE YAML
  COMMENT 'Metric View for trips: rides by day/month, membership split, popular stations/routes, durations.'
AS $$
version: 0.1
source: confessions.default.trips
filter: TO_TIMESTAMP(started_at) IS NOT NULL

dimensions:
  - name: ride_date
    expr: TO_DATE(TO_TIMESTAMP(started_at))
  - name: ride_month
    expr: DATE_TRUNC('MONTH', TO_TIMESTAMP(started_at))
  - name: member_type
    expr: member_casual
  - name: rideable_type
    expr: rideable_type
  - name: start_station
    expr: COALESCE(start_station_name, 'UNKNOWN')
  - name: end_station
    expr: COALESCE(end_station_name, 'UNKNOWN')
  - name: route
    expr: CONCAT(COALESCE(start_station_name, 'UNKNOWN'), ' → ', COALESCE(end_station_name, 'UNKNOWN'))

measures:
  - name: total_rides
    expr: COUNT(1)
  - name: member_rides
    expr: COUNT(1) FILTER (WHERE member_casual = 'member')
  - name: casual_rides
    expr: COUNT(1) FILTER (WHERE member_casual = 'casual')
  - name: avg_trip_minutes
    expr: |
      AVG(
        (UNIX_TIMESTAMP(TO_TIMESTAMP(ended_at)) - UNIX_TIMESTAMP(TO_TIMESTAMP(started_at))) / 60.0
      )
  - name: total_unique_start_stations
    expr: COUNT(DISTINCT start_station_id)
  - name: total_unique_routes
    expr: COUNT(DISTINCT CONCAT(COALESCE(start_station_id, 'UNK'), '->', COALESCE(end_station_id, 'UNK')))
$$;
Bet you weren’t expecting that. Metric Views as YAML, say it ain’t so, oh it’s so.
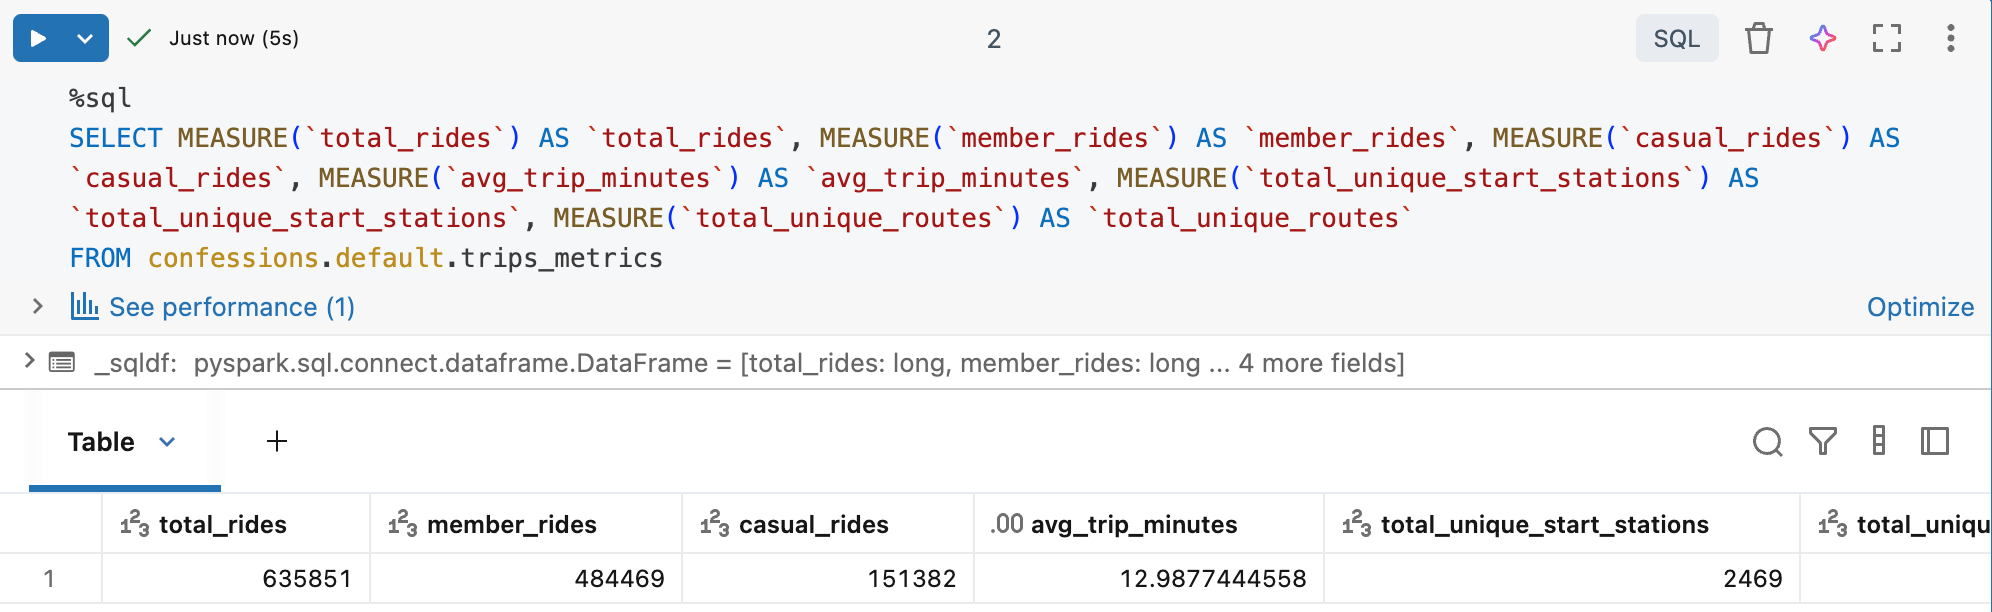
How is this helpful as a Semantic Layer? Well, you would have to agree with me that it’s extremely verbose and very forward about what a “Measure” is.
... metric definitions, which include dimensions and measures, based on
a data source, or multiple sources if join logic is used ... A measure is a value
that summarizes business activity, typically using an aggregate function
such as SUM() or AVG().
We can just be more explicit about defining all important business logic and calculations.
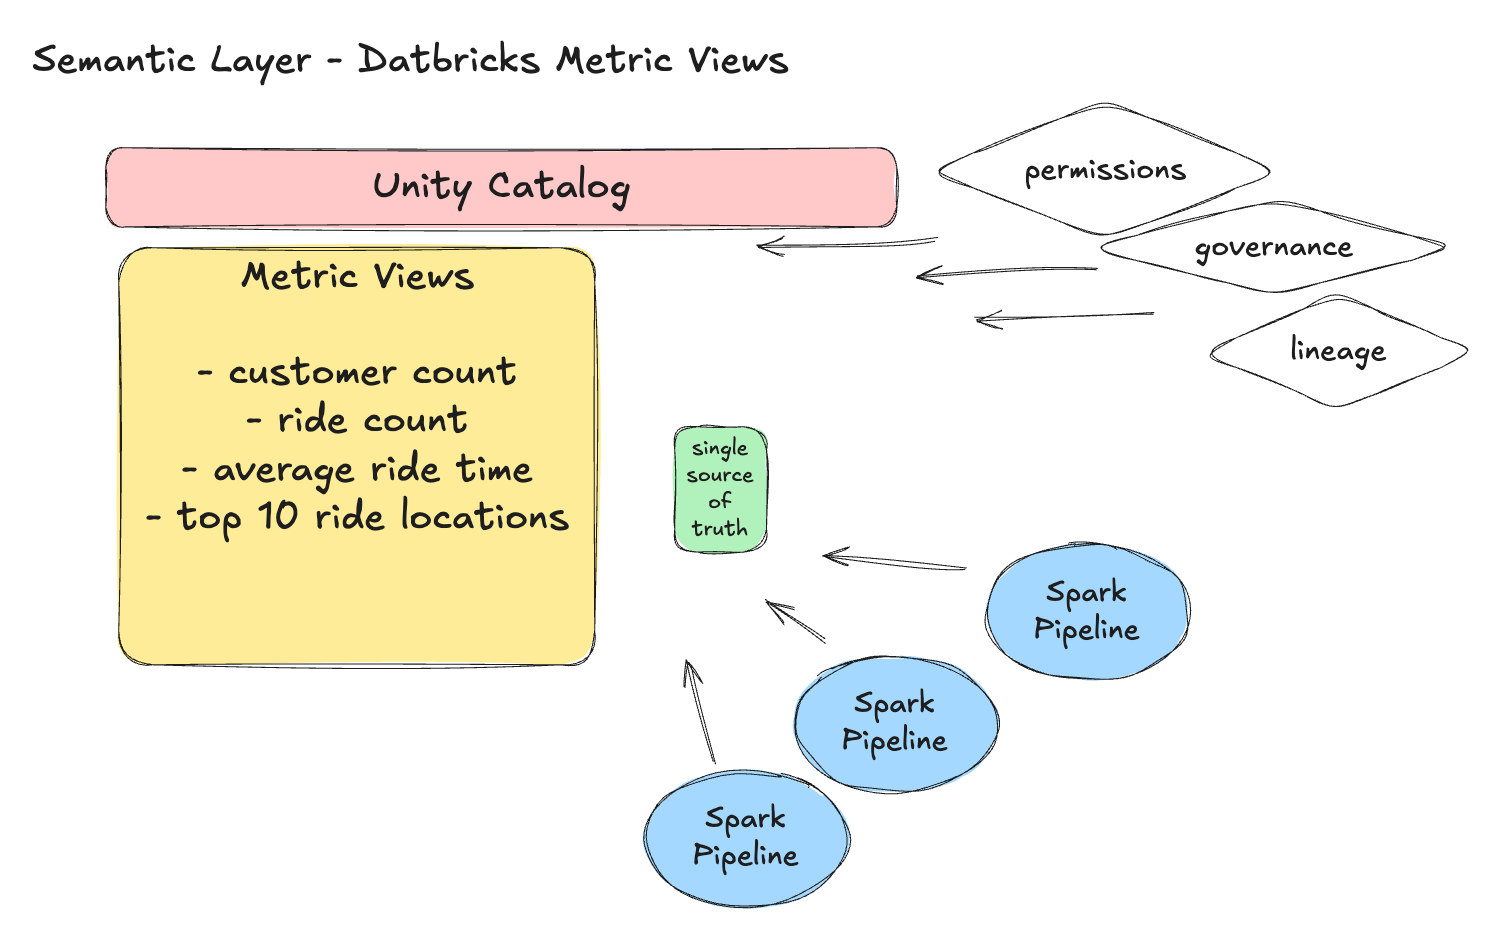
Instead of embedding this sort of logic WITHIN DATA PIPELINE(S) … which is usually what happens, we can just use Metric Views to create a single source of truth for this sort of logic, and require many data pipelines, teams, who or whatever … to get the answer from this single place.
Databricks has taken it even farther, looking forward to Agentic systems, like Genie, and enabling more business logic to be captured to help both humans and machines.

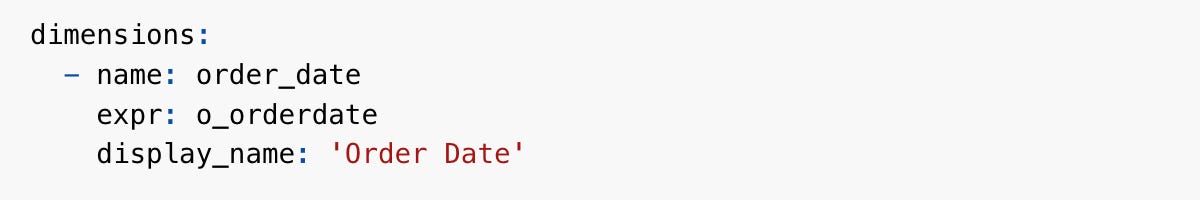
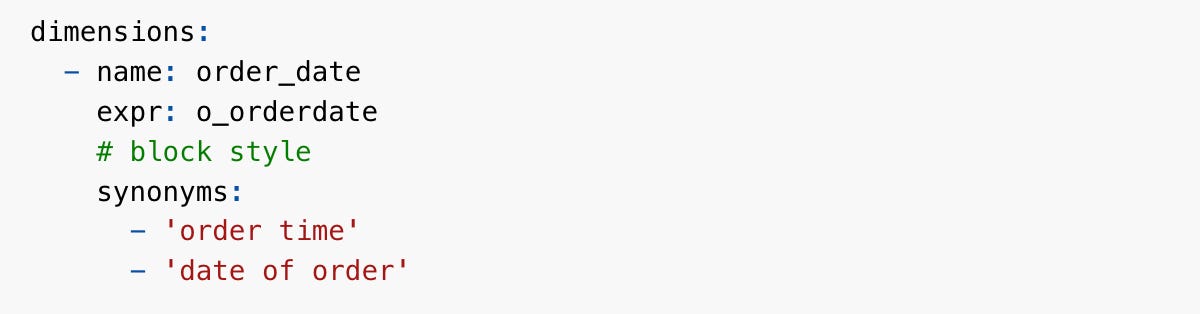
“Semantic metadata includes display names, format specifications, and synonyms that provide additional context.” - docs
For example, display names and synonyms.
The funny thing about business logic, KPIs, aggregates, analytics … whatever you want to call these data points that, many times, literally drive the business … is that the intersection of engineering and business is half art, half science.
Databricks Metric Views are a unique take, and the perfect Semantic Layer to capture not only the very technical details of a METRIC, how something is calculated, but also how the business refers to that idea, with features like synonyms. Amazing.
For most, it’s a mindset shift.
Personally, what I think doesn’t matter that much; it’s more about what the data community as a whole believes and how they act day to day when building and maintaining data platforms. Semantic Layers offer real benefits for organizations of all sizes, especially for medium- to large-sized teams.
Analytics, data feed back to the business, has for decades struggled to provide accurate results that matter, at least that is the common complaint, and it is warranted.
Many, not all, but many of the core problems stem from data teams at large being unable to manage their data, code, and logic coherently and consistently. It always devolves into the wild west, where numbers don’t match, and the business loses all trust in the data and the teams.
Databricks Metric Views, seen and used as a Semantic Layer to devour all business logic and calculations, will go a long way in solving at least some of these problems. Not all, but some.
The question is: if you don't use a Semantic Layer of sorts, how do you plan to manage your key metrics over the long term? How will your data team be any different than the legions that came before you, and dropped the data ball?

Try Thesys Agent Builder — build your own data insights agent in 5 minutes.
good stuff; I'm not sure if you can answer this one, but is there a way via a JDBC driver to expose a semantic view from databricks in another BI tool such as Tableau or Power BI, or dare I say Excel?
One of the nice things about Cube JS semantic layers is you can connect them in excel, PBI, and Tableau with relative ease for drag and drop ad hoc analytics, like the good ole SSAS days