The Age-old Problem - Logging and Monitoring
Two Pillars of Data Engineering
Over the years of churning and burning in the Data Engineering space, there are a lot of things that have changed. Some tech is being pushed into the rusty scrap pile of the moldering and smoldering tools of yore.
Yet, there are a few things that haven’t changed at all, they are the stone pillars standing beaten and weathered over the eons, and refuse to change or go anywhere.
Logging and Monitoring are two of those wizened old oak trees. So boring that no one bothers with talking about them much, yet they are at the core of everything we do in this distributed age.
Today we shall sit and cross our legs under these forlorn and forgotten topics and see what comes to mind.
You should check out Prefect, the sponsor of the newsletter this week! Prefect is a workflow orchestration tool that gives you observability across all of your data pipelines. Deploy your Python code in minutes with Prefect Cloud.
Logging and Monitoring - Useless or useful?
Some topics are evergreen and never leave, like SQL, other things are second-class citizens. I imagine it’s because they are “not that cool” maybe?
After building many data platforms over the years, all the way from custom distributed systems on Kubernetes to simply using Databricks … there is one thing that has never changed.
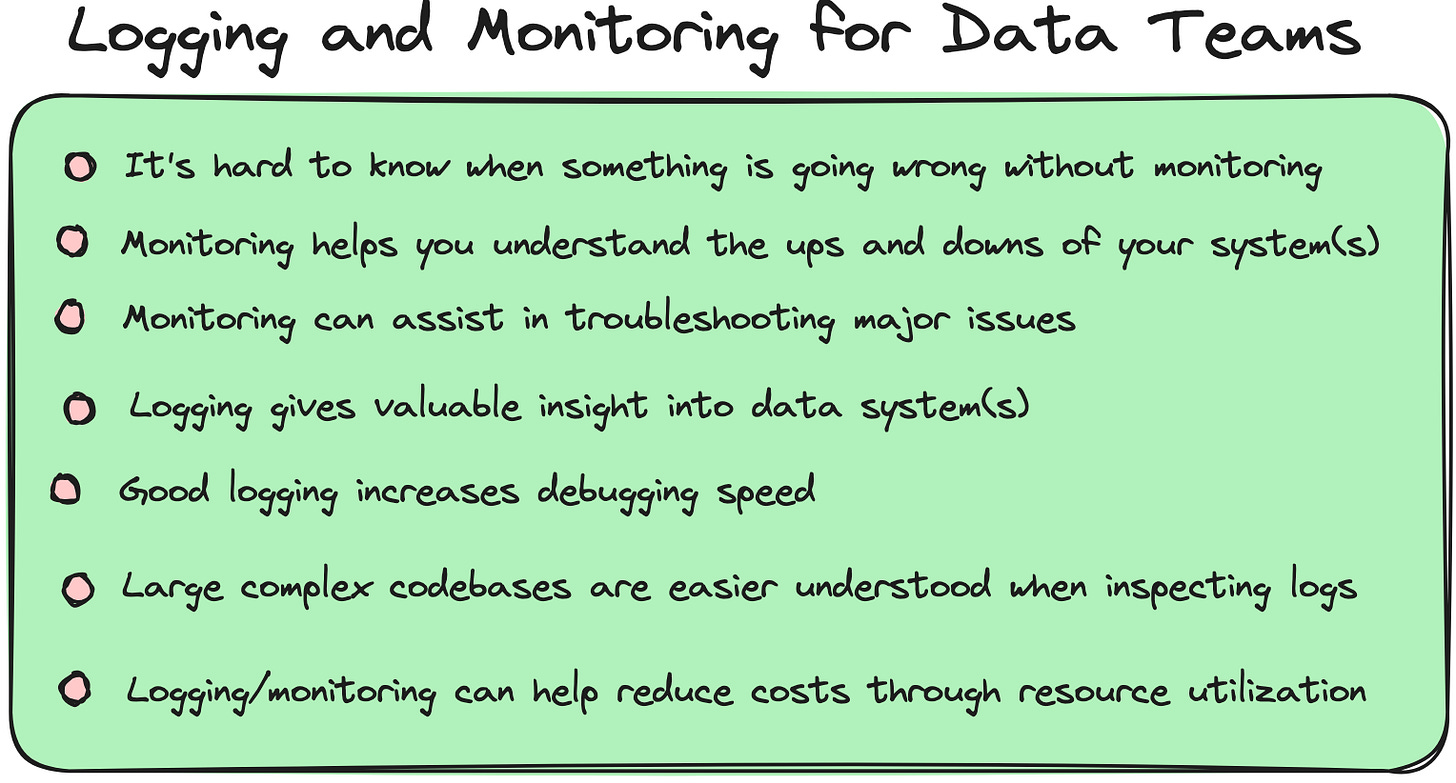
Logging and Monitoring are undervalued and of upmost importance to anyone in the Data Engineering space. They can often make or break a system, make something either usable or unusable, loved or unloved.
Why, you ask? How can something so simple like Logging and Monitoring be so important?
It seems so straightforward, but I've learned over the years that it’s always the simple stuff that can make you sink or swim.
First, let’s talk about Logging.
Logging for Data Engineers.
I suppose if you just wander around life writing code and not thinking about logging, you just might not be familiar with some common terms you can hear when people talk about logging.
Here are some general basics that will get you started in the right direction.
Generally speaking, we can throw logging into two different camps.
Diagnostics
Audit
Generally speaking, audit logging would be logs sprinkled in and around the business logic and flow, very helpful for bugs when things go wrong.
Secondly, diagnostic logs are more technical in nature. They may tell you stuff about database connections, queries, API calls, retries, etc.
Together, both these “types” or “approaches” to the “what” of logging complex systems, can go a long way in understanding and troubleshooting problems.
Beyond these two general types of logs, there are different levels of logging, it’s common to run into these terms:
Debug: logs detailed information.
Info: logs general flow and events.
Warning: logs potentially problematic situations.
Error: logs for critical errors.
Logging in Python - with examples.
Probably one of the easiest ways to “get into logging” is to simply start out with the Python logging package. It’s as easy as an import, and of course, there are a lot of configurations that can be done, but, getting logs to STDOUT has never been easier.
Easy!
Come on an imaginary trip with me, close your eyes, and away we wisk to a large and complicated codebase full of complex and large data pipelines.
You’re new to the codebase, you’ve only been at it 6 months and have barely scratched the surface of most of the code. You are on call for the weekend, your boss is gone, and of course, you get a production failure alert for a pipeline you’ve never seen.
There are two options …
You have logs that tell you generally what was happening in the script and how far it went before the failure.
You have nothing and have to figure it out yourself.
That’s how you have to think about and approach logs.
Let’s take this play Polars data pipeline for a second, and pretend it is much larger and more complex.
You can see it’s easy to use logging.info() sort of log where in the script things are at, and possibly variables like “where am I writing data too.”
Also, you can get fancy and log “business logic” type warnings. Things like this can make a huge difference in a large complex codebase. In the above example, I chose to large a WARN level if the dataframe is empty.
I hope this is getting your wheels spinning in your head, get those cobwebs blown out. Logging is a powerful underused tool in the belt of the Data Engineers.
It makes debugging easier and understanding new codebases easier. Without good logs, the developer is at the mercy of their own experience and a dash of good luck.
Ok, let’s move on and talk about monitoring.
Monitoring for Data Engineers
This topic can be a little more difficult to get our hands around, simply because it’s “not as easy” as logging. By easy I mean … more complicated. Which can make it hard to talk about it, but we will give it our best shot.
It can be two sides of a coin …
If you’ve never had good monitoring, you don’t know what you’re missing.
If you use good monitoring tools, you know how much of a game-changer it can be.
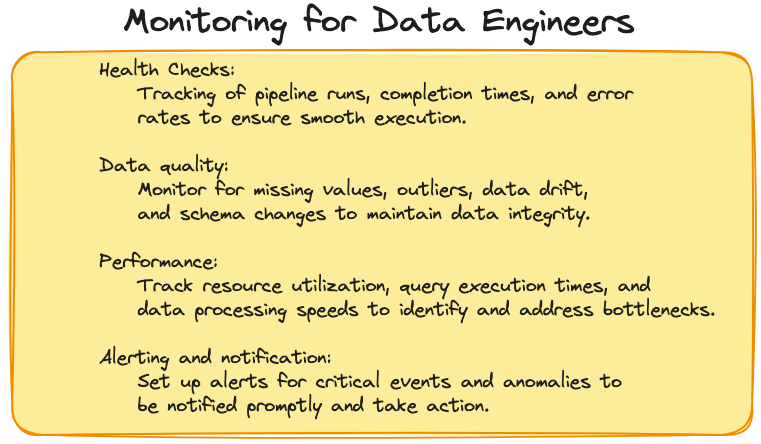
Of course, monitoring depends on the tools you are using, but nonetheless, it can be game-changing to know …
Are things working well or not?
Resource utilization, where the money or compute is being burned.
A bird’s eye view into the data platform infrastructure.
When data pipelines start to grow in number and complexity, you can’t rely on some cron jobs on an EC2 instance to keep the lights on.
The key to monitoring is to have a visual inspection of what is running and what the status is.

Not only do Data Engineers have, and provide, high-level monitoring of the data systems, but they also have the ability to dig into problem spots and see where tasks are long-running, where something is always failing, and other issues are key to running a data platform in a healthy way.
There are a lot of options when you start “looking into monitoring” for data teams. It can be overwhelming at first.
I would suggest a few things to make your life easier.
Choose data tools, like Prefect, that have monitoring built-in.
It’s easier to use what you have than start from scratch.
Start simple
You probably need basic info like what is or is not running.
Or what is taking the longest to run, where are the bottlenecks?
If you can start with just getting a bird’s eye view into your resources and processes, be able to understand what is breaking, what is not, what is running well, and what is not … you can solve a lot of problems.
Now you don’t have to guess, you can save money by looking for over, or under-utilized resources. You can long for the 80/20 rule, what are the 20% that are running long and eating all the costs?
Heck, maybe your monitoring doesn’t work well and you realize you have an architecture problem because you can’t monitor your system well. That tells you something important as well.
Take this moment to think about your monitoring … what you are using today? Can you answer these simple questions?
What is running the longest?
What breaks the most often?
How many things are we running?
If you can’t answer those questions with your monitoring … what does that tell you?
Let us know in the comments what your best or worse experiences are with data monitoring in logging. What has worked well, what has not?


